Exam 4: Understanding and Comparing Distributions
Exam 1: Data30 Questions
Exam 2: Displaying and Describing Categorical Data65 Questions
Exam 3: Displaying and Summarizing Quantitative Data93 Questions
Exam 4: Understanding and Comparing Distributions102 Questions
Exam 5: The Standard Deviation As a Ruler and the Normal Model131 Questions
Exam 6: Scatterplots, association, and Correlation74 Questions
Exam 7: Linear Regression57 Questions
Exam 8: Regression Wisdom32 Questions
Exam 9: Re-Expressing Data: Get It Straight51 Questions
Exam 10: Understanding Randomness26 Questions
Exam 11: Sample Surveys50 Questions
Exam 12: Experiments and Observational Surveys87 Questions
Exam 13: From Randomness to Probability64 Questions
Exam 14: Probability Rules90 Questions
Exam 15: Random Variables112 Questions
Exam 16: Probability Models114 Questions
Exam 17: Sampling Distribution Models45 Questions
Exam 18: Confidence Intervals for Proportions56 Questions
Exam 19: Testing Hypotheses About Proportions50 Questions
Exam 20: More About Tests69 Questions
Exam 21: Comparing Two Proportions52 Questions
Exam 22: Inferences About Means106 Questions
Exam 23: Comparing Means43 Questions
Exam 24: Paired Samples and Blocks33 Questions
Exam 25: Comparing Counts78 Questions
Exam 26: Inferences for Regression51 Questions
Exam 27: Analysis of Variance39 Questions
Exam 28: Multifactor Analysis of Variance22 Questions
Exam 29: Multiple Regression22 Questions
Exam 30: Multiple Regression Wisdom21 Questions
Exam 31: Rank-Based Nonparametric Tests29 Questions
Exam 32: The Bootstrap31 Questions
Select questions type
Describe what these boxplots tell you about the relationship between the provinces and salary,based on the same occupation. 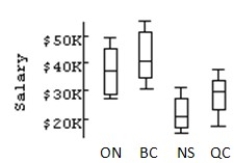
(Multiple Choice)
4.8/5  (46)
(46)
A class of sixth graders takes a diagnostic reading test,and the scores are reported by reading grade level.The 5-number summaries for the 20 boys and 21 girls are shown:  a)Which group had the highest score?
b)Which group had the greatest range?
c)Which group had the greatest interquartile range?
d)Which group's scores appear to be more skewed? Explain.
e)Which group generally did better on the test? Explain.
f)If the mean reading level for boys was 6.6 and for girls was 6.4,what is the overall mean for the class?
a)Which group had the highest score?
b)Which group had the greatest range?
c)Which group had the greatest interquartile range?
d)Which group's scores appear to be more skewed? Explain.
e)Which group generally did better on the test? Explain.
f)If the mean reading level for boys was 6.6 and for girls was 6.4,what is the overall mean for the class?
(Essay)
4.9/5 (28)
Filters
- Essay(0)
- Multiple Choice(0)
- Short Answer(0)
- True False(0)
- Matching(0)