Exam 4: Understanding and Comparing Distributions
Exam 1: Data30 Questions
Exam 2: Displaying and Describing Categorical Data65 Questions
Exam 3: Displaying and Summarizing Quantitative Data93 Questions
Exam 4: Understanding and Comparing Distributions102 Questions
Exam 5: The Standard Deviation As a Ruler and the Normal Model131 Questions
Exam 6: Scatterplots, association, and Correlation74 Questions
Exam 7: Linear Regression57 Questions
Exam 8: Regression Wisdom32 Questions
Exam 9: Re-Expressing Data: Get It Straight51 Questions
Exam 10: Understanding Randomness26 Questions
Exam 11: Sample Surveys50 Questions
Exam 12: Experiments and Observational Surveys87 Questions
Exam 13: From Randomness to Probability64 Questions
Exam 14: Probability Rules90 Questions
Exam 15: Random Variables112 Questions
Exam 16: Probability Models114 Questions
Exam 17: Sampling Distribution Models45 Questions
Exam 18: Confidence Intervals for Proportions56 Questions
Exam 19: Testing Hypotheses About Proportions50 Questions
Exam 20: More About Tests69 Questions
Exam 21: Comparing Two Proportions52 Questions
Exam 22: Inferences About Means106 Questions
Exam 23: Comparing Means43 Questions
Exam 24: Paired Samples and Blocks33 Questions
Exam 25: Comparing Counts78 Questions
Exam 26: Inferences for Regression51 Questions
Exam 27: Analysis of Variance39 Questions
Exam 28: Multifactor Analysis of Variance22 Questions
Exam 29: Multiple Regression22 Questions
Exam 30: Multiple Regression Wisdom21 Questions
Exam 31: Rank-Based Nonparametric Tests29 Questions
Exam 32: The Bootstrap31 Questions
Select questions type
Here is the stem-and-leaf display of the midterm test scores for the seventh-period mathematics class.
Midterm Test Scores  Key:
7 | 5 = 75 points
Key:
7 | 5 = 75 points
(Multiple Choice)
4.8/5  (29)
(29)
Here are summary statistics for the time,in minutes,it took for 20 people to complete an information survey at a walk-in medical clinic.  Write a few sentences about the amount of time these people took to complete the information survey.
(Multiple Choice)
4.9/5 (26)
Here are the summary statistics for mathematics scores for one high-school graduating class. 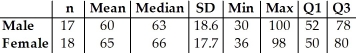 Choose the boxplot that represents the given data.
I II III
Choose the boxplot that represents the given data.
I II III 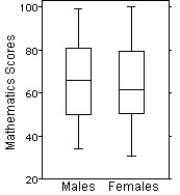

 IV V
IV V 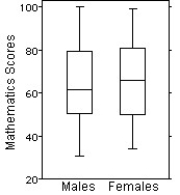
(Multiple Choice)
4.8/5 (36)
Shown below are the data and summary statistics for the reading scores of 29 fifth graders. 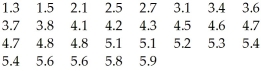
 Write a brief summary of the performance of the fifth graders.
(Multiple Choice)
4.8/5 (31)
In a child psychology course,children took part in an experiment to determine how,while putting together a 10-piece puzzle,being able to view the completed picture affected the time required for the child to complete the puzzle.One group (NV)was not allowed to look at the picture on the cover of the puzzle box.A second group (VP)was allowed to view the picture on the cover of the box.Below are the boxplots of the original completion times and the boxplots of the log of the completion times. 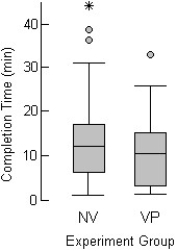
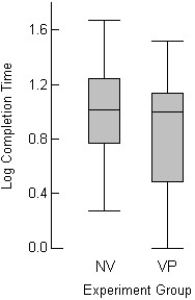 Is it better to analyze the original completion times or the log of the completion times? Explain.
(Essay)
4.9/5 (33)
Here are boxplots of the points scored during the first 10 games of the basketball season for both Caroline and Alexandra.Summarize the similarities and differences in their performance so far. 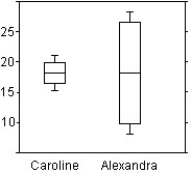
(Multiple Choice)
4.8/5 (29)
The normal annual precipitation (in millimetres)is given below for 21 different cities. 
(Multiple Choice)
4.9/5 (38)
Office workers were asked how long it took them,in minutes,to travel to work one morning.Here is the stem-and-leaf display. 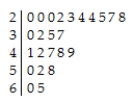 Without actually finding the mean and the median,would you expect the mean to be higher or lower than the median?
(Multiple Choice)
4.8/5 (34)
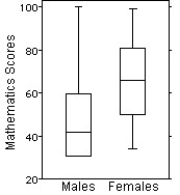
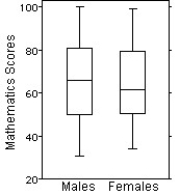
Here are the summary statistics for mathematics scores for one high school graduating class,and the parallel boxplots comparing the scores of male and female students.Write a brief report on these results.Be sure to discuss shape,centre,and spread of the scores. 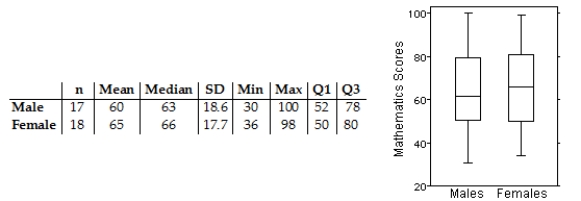
(Multiple Choice)
4.7/5 (36)
The heights,in centimetres,of 18 randomly selected Grade 8 students are given below. 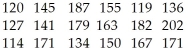
(Multiple Choice)
4.8/5 (36)
Here are the heights,in centimetres,of 32 Grade 3 students. 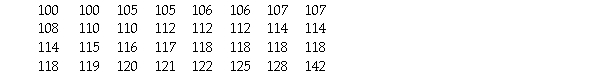
(Multiple Choice)
4.8/5 (25)
The frequency table shows the weight ,in kilograms,of 120 adults,rounded to the nearest kilogram. 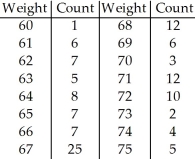
(Multiple Choice)
4.9/5 (35)
Three statistics classes (50 students each)took the same test.Shown below are histograms of the scores for the classes.Use the histograms to answer the question. 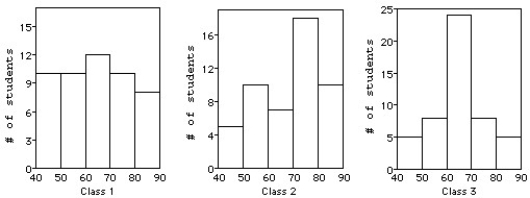 -Which class had the highest median score?
(Multiple Choice)
4.8/5 (37)
The stem-and-leaf diagram shows the ages of 17 people at a playground in Halifax,Nova Scotia. 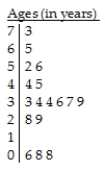 Key:
3 | 4 = 34 years
Key:
3 | 4 = 34 years
(Multiple Choice)
4.8/5 (40)
Here is a histogram of the assets (in millions of dollars)of 71 companies.The logarithm re-expression of assets is also given.In the logarithm re-expression,what does the value 2.25 actually indicate about the company's assets? 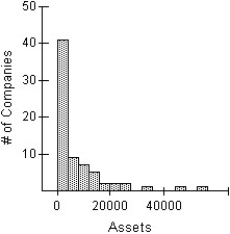
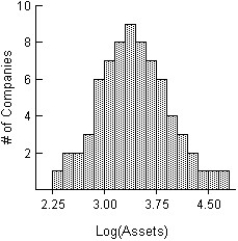
(Multiple Choice)
4.8/5 (34)
Use the Olympic gold medal performances in the men's high jump from the years 1960 - 1984 to construct a timeplot. 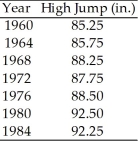
(Essay)
4.9/5 (36)
Filters
- Essay(0)
- Multiple Choice(0)
- Short Answer(0)
- True False(0)
- Matching(0)