Exam 4: Understanding and Comparing Distributions
Exam 1: Data30 Questions
Exam 2: Displaying and Describing Categorical Data65 Questions
Exam 3: Displaying and Summarizing Quantitative Data93 Questions
Exam 4: Understanding and Comparing Distributions102 Questions
Exam 5: The Standard Deviation As a Ruler and the Normal Model131 Questions
Exam 6: Scatterplots, association, and Correlation74 Questions
Exam 7: Linear Regression57 Questions
Exam 8: Regression Wisdom32 Questions
Exam 9: Re-Expressing Data: Get It Straight51 Questions
Exam 10: Understanding Randomness26 Questions
Exam 11: Sample Surveys50 Questions
Exam 12: Experiments and Observational Surveys87 Questions
Exam 13: From Randomness to Probability64 Questions
Exam 14: Probability Rules90 Questions
Exam 15: Random Variables112 Questions
Exam 16: Probability Models114 Questions
Exam 17: Sampling Distribution Models45 Questions
Exam 18: Confidence Intervals for Proportions56 Questions
Exam 19: Testing Hypotheses About Proportions50 Questions
Exam 20: More About Tests69 Questions
Exam 21: Comparing Two Proportions52 Questions
Exam 22: Inferences About Means106 Questions
Exam 23: Comparing Means43 Questions
Exam 24: Paired Samples and Blocks33 Questions
Exam 25: Comparing Counts78 Questions
Exam 26: Inferences for Regression51 Questions
Exam 27: Analysis of Variance39 Questions
Exam 28: Multifactor Analysis of Variance22 Questions
Exam 29: Multiple Regression22 Questions
Exam 30: Multiple Regression Wisdom21 Questions
Exam 31: Rank-Based Nonparametric Tests29 Questions
Exam 32: The Bootstrap31 Questions
Select questions type
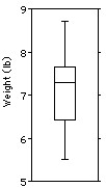
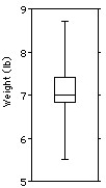
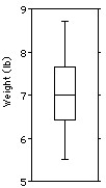
The weights (in pounds)of 30 newborn babies are listed below. 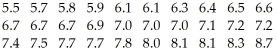 Choose the boxplot that represents the given data.
I II III
Choose the boxplot that represents the given data.
I II III 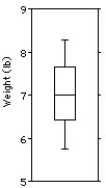
 IV V
IV V 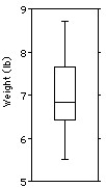
(Multiple Choice)
4.8/5  (39)
(39)
Here are some summary statistics for all of the runners in a local 12 kilometre race:
Slowest time = 121 minutes
Mean = 76 minutes
Median = 76 minutes
Range = 91 minutes
IQR = 57
Q1 = 30
Standard deviation = 13 minutes
Between what two values are the middle 50% of times?
(Multiple Choice)
4.8/5 (26)
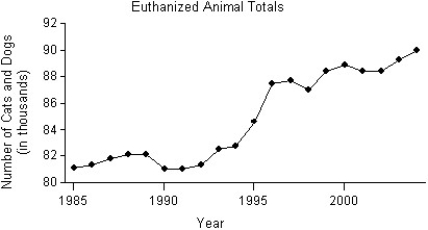
The following stem-and-leaf display shows the number of homeless cats and dogs that had to be euthanized each year in a large city for the period 1985-2004.Use both the stemplot and timeplot to describe the distribution. 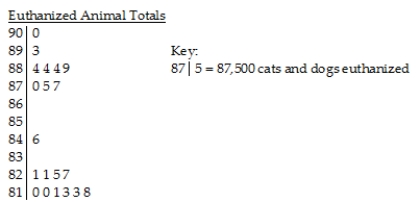
(Multiple Choice)
4.8/5 (31)
The weekly salaries (in dollars)of 24 randomly selected employees of a company are shown below. 
(Multiple Choice)
4.8/5 (36)
The weekly salaries (in dollars)of sixteen government workers are listed below. 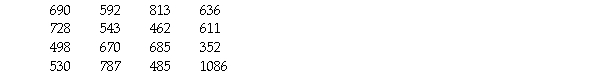
(Multiple Choice)
4.7/5 (24)
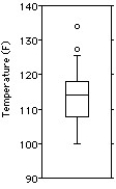
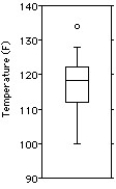
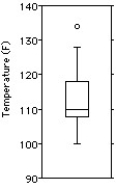
Here are the highest temperatures ever recorded (in °F)in 32 different states in the U.S.A. 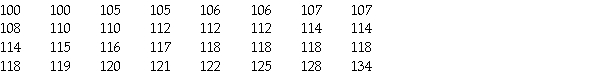 Choose the boxplot that represents the given data.
I II III
Choose the boxplot that represents the given data.
I II III 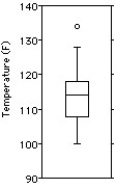
 IV V
IV V 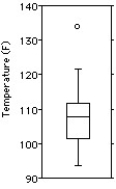
(Multiple Choice)
4.8/5 (31)
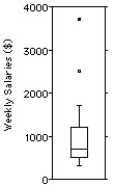
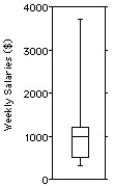
The weekly salaries (in dollars)of 24 randomly selected employees of a company are shown below.  Choose the boxplot that represents the given data.
I II III
Choose the boxplot that represents the given data.
I II III 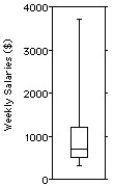
 IV V
IV V 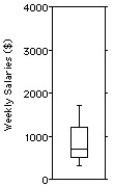
(Multiple Choice)
4.8/5 (32)
Use the high closing values of Naristar Inc.stock from the years 1990 - 2001 to construct a timeplot. 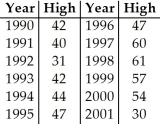
(Essay)
4.9/5 (32)
Shown below are the boxplot,the histogram and summary statistics for the weights (in pounds)of 30 newborn babies: 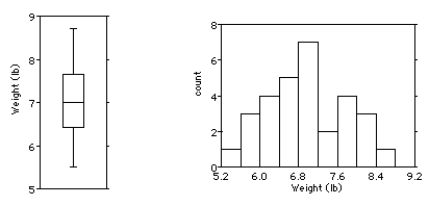
 Write a few sentences describing the distribution.
(Multiple Choice)
4.8/5 (36)
Shown below are the boxplot and the histogram for the weekly salaries (in dollars)of 24 randomly selected employees of a company: 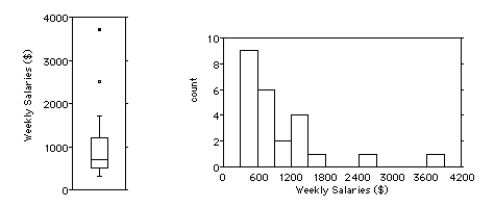 i.What features of the distribution can you see in both the histogram and the boxplot?
ii.What features of the distribution can you see in the boxplot that you could not see in the histogram?
i.What features of the distribution can you see in both the histogram and the boxplot?
ii.What features of the distribution can you see in the boxplot that you could not see in the histogram?
(Multiple Choice)
4.9/5 (31)
Here are summary statistics for the time,in minutes,it took for 20 people to complete an information survey at a walk-in medical clinic.  Would you describe this distribution as symmetric or skewed?
(Multiple Choice)
4.8/5 (37)
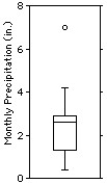
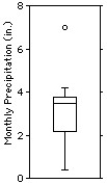
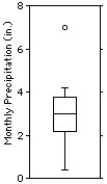
The normal monthly precipitation (in inches)for August is listed for 20 different cities in the U.S.A.. 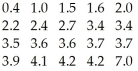 Choose the boxplot that represents the given data.
I II III
Choose the boxplot that represents the given data.
I II III 
 IV V
IV V 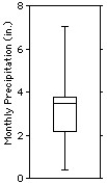
(Multiple Choice)
4.9/5 (32)
Here are 3 boxplots of weekly gas prices at a service station in the U.S.A.(price in $ per gallon).Compare the distribution of prices over the three years. 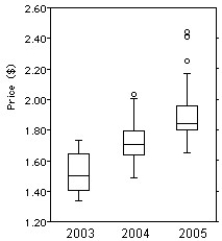
(Multiple Choice)
4.7/5 (35)
Here are boxplots of the points scored during the first 10 games of the basketball season for both Caroline and Alexandra.The coach can take only one player to the state championship.Which one should she take knowing that she would like a safe player? 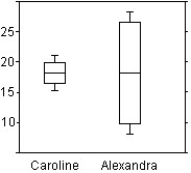
(Multiple Choice)
4.8/5 (36)
The weekly salaries (in dollars)of 24 randomly selected employees of a company are shown below,and displayed on the following boxplot. 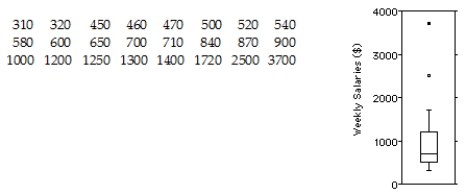 Find the IQR and the standard deviation.Which is the most appropriate measure of spread?
(Multiple Choice)
4.8/5 (35)
Use the high closing values of Naristar Inc.stock from the years 1992 - 2003 to construct a timeplot. 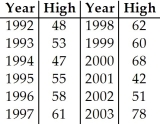
(Essay)
4.8/5 (31)
Shown below are the boxplot and summary statistics for the heights,in centimetres,of a class of Grade 3 students in Halifax,NS. 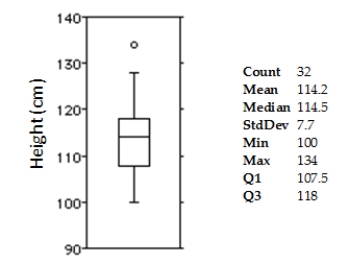 Which measures of centre and spread would you use for this distribution?
(Multiple Choice)
4.9/5 (39)
A local ice cream shop hand scoops each of its ice cream cones.The cones vary in weight from 126 grams to 291 grams with a mean of 181 grams and a standard deviation of 34 grams.The quartiles and median weights are 157,255,and 202 ounces.A customer makes a special order of a 448 ounce cone.
Which of the summary statistics might not change if that data value was added to the distribution?
(Multiple Choice)
4.9/5 (33)
A student at a local university took a total of 20 exams during freshman year.The student recorded the exam scores as percentages and created the following stem-and-leaf display.The lower stem contains leaves with the digits 0-4 and the upper stem contains leaves with digits 5-9.In addition to describing the distribution,give a reason to account for the shape of this distribution. 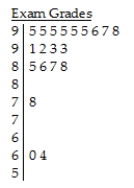 Key:
9 | 2 = 92%
Key:
9 | 2 = 92%
(Multiple Choice)
4.9/5 (41)
Filters
- Essay(0)
- Multiple Choice(0)
- Short Answer(0)
- True False(0)
- Matching(0)