Exam 4: Understanding and Comparing Distributions
Exam 1: Data30 Questions
Exam 2: Displaying and Describing Categorical Data65 Questions
Exam 3: Displaying and Summarizing Quantitative Data93 Questions
Exam 4: Understanding and Comparing Distributions102 Questions
Exam 5: The Standard Deviation As a Ruler and the Normal Model131 Questions
Exam 6: Scatterplots, association, and Correlation74 Questions
Exam 7: Linear Regression57 Questions
Exam 8: Regression Wisdom32 Questions
Exam 9: Re-Expressing Data: Get It Straight51 Questions
Exam 10: Understanding Randomness26 Questions
Exam 11: Sample Surveys50 Questions
Exam 12: Experiments and Observational Surveys87 Questions
Exam 13: From Randomness to Probability64 Questions
Exam 14: Probability Rules90 Questions
Exam 15: Random Variables112 Questions
Exam 16: Probability Models114 Questions
Exam 17: Sampling Distribution Models45 Questions
Exam 18: Confidence Intervals for Proportions56 Questions
Exam 19: Testing Hypotheses About Proportions50 Questions
Exam 20: More About Tests69 Questions
Exam 21: Comparing Two Proportions52 Questions
Exam 22: Inferences About Means106 Questions
Exam 23: Comparing Means43 Questions
Exam 24: Paired Samples and Blocks33 Questions
Exam 25: Comparing Counts78 Questions
Exam 26: Inferences for Regression51 Questions
Exam 27: Analysis of Variance39 Questions
Exam 28: Multifactor Analysis of Variance22 Questions
Exam 29: Multiple Regression22 Questions
Exam 30: Multiple Regression Wisdom21 Questions
Exam 31: Rank-Based Nonparametric Tests29 Questions
Exam 32: The Bootstrap31 Questions
Select questions type
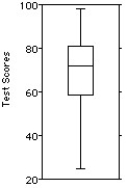
Shown below are the boxplot,the histogram and summary statistics for the highest temperatures ever recorded (in °F)in 32 different states in the U.S.A. 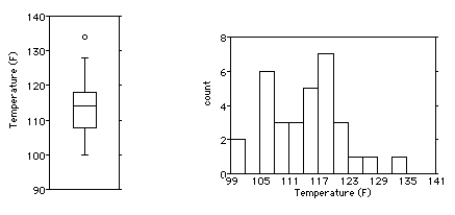
 Write a few sentences describing the distribution.
(Multiple Choice)
4.9/5  (32)
(32)
The boxplots display case prices (in dollars)of white wines produced by three vineyards in south-western Ontario.In which vineyard are the wines generally more expensive? 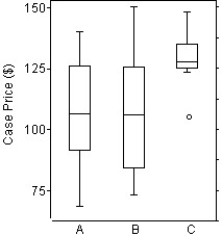
(Multiple Choice)
4.7/5 (43)
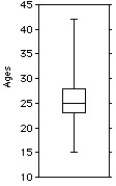
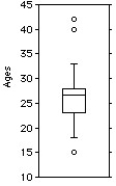
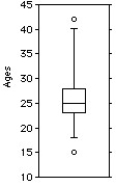
The ages of the 21 members of a track and field team are listed below. 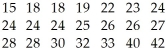 Choose the boxplot that represents the given data.
I II III
Choose the boxplot that represents the given data.
I II III 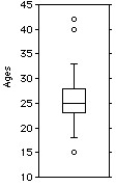
 IV V
IV V 
(Multiple Choice)
4.9/5 (28)
Here is the stem-and-leaf display of the midterm test scores for a high school typing class. 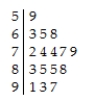 Would you use the median or the mean to describe the centre of this distribution?
(Multiple Choice)
4.8/5 (33)
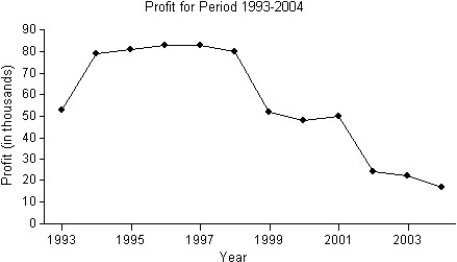
A business owner recorded her annual profits for the first 12 years since opening her business in 1993.The stem-and-leaf display below shows the annual profits in thousands of dollars.Use both the stemplot and timeplot to describe the distribution. 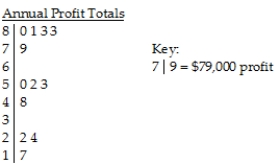
(Multiple Choice)
4.8/5 (29)
Here is a histogram of the assets (in millions of dollars)of 71 companies. 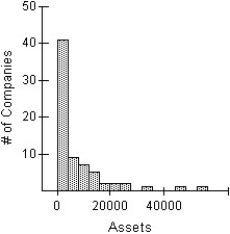 Which of the following is an appropriate re-expression of these data? (More than one may be appropriate. )
I II
Which of the following is an appropriate re-expression of these data? (More than one may be appropriate. )
I II 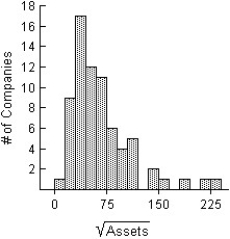
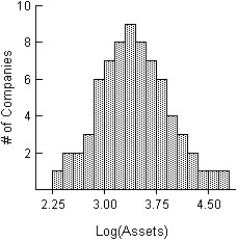 III
III 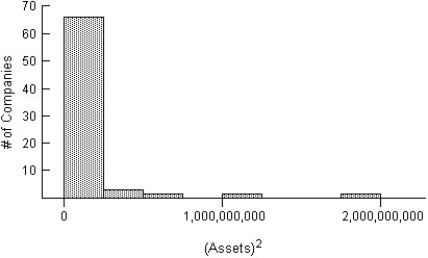
(Multiple Choice)
4.9/5 (26)
The back-to-back stem-and-leaf display compares the annual precipitation,in millimetres,of of two towns over a period of 14 years.The lower stem contains leaves with the digits 0-4 and the upper stem contains leaves with digits 5-9. 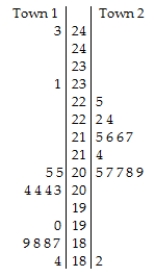 Key:
20 | 7 = 20.7 millimetres
Key:
20 | 7 = 20.7 millimetres
(Multiple Choice)
4.9/5 (45)
In May 2011,17 coffee shops in Vancouver charged the following amounts,in dollars,for a large cup of coffee (including tax).The lower stem contains leaves with the digits 0-4 and the upper stem contains leaves with digits 5-9. 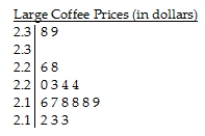 Key:
2.1 | 7 = $2.17
Key:
2.1 | 7 = $2.17
(Multiple Choice)
4.8/5 (36)
The times,in minutes,it took for 21 students to finish writing a statistics test are given below. 
(Multiple Choice)
4.9/5 (29)
Shown below are the boxplot and the histogram for the weights (in pounds)of 30 newborn babies in the U.S.A.. 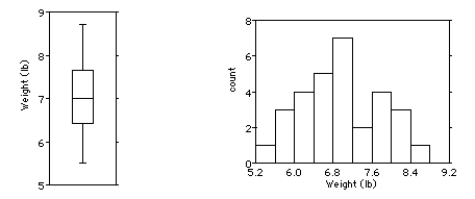 i.What features of the distribution can you see in both the histogram and the boxplot?
ii.What features of the distribution can you see in the histogram that you could not see in the boxplot?
i.What features of the distribution can you see in both the histogram and the boxplot?
ii.What features of the distribution can you see in the histogram that you could not see in the boxplot?
(Multiple Choice)
4.9/5 (30)
Do men and women run a 5-kilometre race at the same pace? Here are boxplots of the time (in minutes)for a race recently run in Victoria,B.C..Write a brief report discussing what these data show. 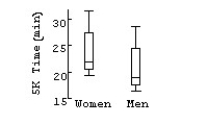
(Multiple Choice)
4.8/5 (41)
The Ontario Ministry of Education collects data on the number of years of teaching experience of high school teachers.A sample taken this year of 19 high school teachers yielded the following data on number of years of teaching experience. 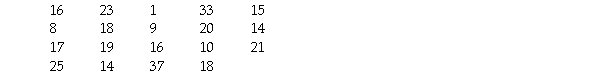
(Multiple Choice)
4.8/5 (35)
Here are the average mathematics achievement scores for ninth graders in 34 counties. 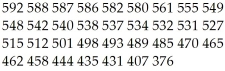
(Multiple Choice)
4.7/5 (29)
Here are some statistics for the annual Wildcat golf tournament:
Lowest score = 57
Mean score = 97
Median = 105
Range = 93
IQR = 109
Q1 = 39
Standard deviation = 14
Between what two values are the middle 50% of the scores found?
(Multiple Choice)
4.9/5 (35)
The test scores of 40 students are listed below. 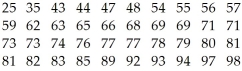 Choose the boxplot that represents the given data.
I II III
Choose the boxplot that represents the given data.
I II III 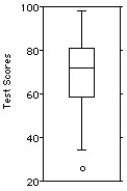
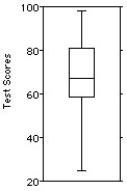
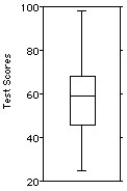 IV V
IV V 
(Multiple Choice)
4.8/5 (39)
A medical study of the effects of on Drug X asked adult volunteers to take a heart-rate test one hour after taking Drug X.Some took a placebo (a pill containing no active ingredients),some were given a regular dose of Drug X,and others were given half a regular dose of Drug X.Here are the 5-number summaries for each group's scores on the test (# of beats that the heart rate increased when timed for 60 seconds): 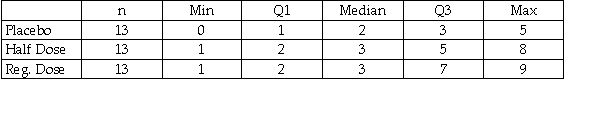 a)Describe the W's for these data.
b)Name the variables and classify each as categorical or quantitative.
c)Write a few sentences comparing the results of the three groups (create parallel boxplots to help you,if necessary. )
a)Describe the W's for these data.
b)Name the variables and classify each as categorical or quantitative.
c)Write a few sentences comparing the results of the three groups (create parallel boxplots to help you,if necessary. )
(Essay)
4.9/5 (41)
Here are the average mathematics achievement scores for ninth graders in 32 counties. 
(Multiple Choice)
4.9/5 (37)
The centre for health in a certain country compiles data on the length of stay by patients in short-term hospitals and publishes its statistical findings annually.Data from a sample of 67 male patients and 63 female patients on length of stay (in days)are displayed in the histograms below. 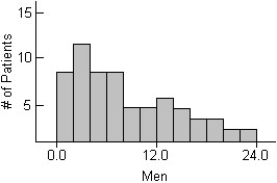
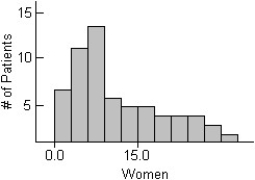 i)What would you suggest be changed about these histograms to make them easier to compare?
ii)Describe these distributions by writing a few sentences comparing the duration of hospitalization for men and women.
Iii)Can you suggest a reason for the peak in women's length of stay?
i)What would you suggest be changed about these histograms to make them easier to compare?
ii)Describe these distributions by writing a few sentences comparing the duration of hospitalization for men and women.
Iii)Can you suggest a reason for the peak in women's length of stay?
(Multiple Choice)
4.9/5 (26)
The weekly salaries (in dollars)of sixteen government workers are listed below. 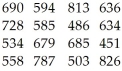
(Multiple Choice)
4.8/5 (31)
Filters
- Essay(0)
- Multiple Choice(0)
- Short Answer(0)
- True False(0)
- Matching(0)