Exam 4: Understanding and Comparing Distributions
Exam 1: Data30 Questions
Exam 2: Displaying and Describing Categorical Data65 Questions
Exam 3: Displaying and Summarizing Quantitative Data93 Questions
Exam 4: Understanding and Comparing Distributions102 Questions
Exam 5: The Standard Deviation As a Ruler and the Normal Model131 Questions
Exam 6: Scatterplots, association, and Correlation74 Questions
Exam 7: Linear Regression57 Questions
Exam 8: Regression Wisdom32 Questions
Exam 9: Re-Expressing Data: Get It Straight51 Questions
Exam 10: Understanding Randomness26 Questions
Exam 11: Sample Surveys50 Questions
Exam 12: Experiments and Observational Surveys87 Questions
Exam 13: From Randomness to Probability64 Questions
Exam 14: Probability Rules90 Questions
Exam 15: Random Variables112 Questions
Exam 16: Probability Models114 Questions
Exam 17: Sampling Distribution Models45 Questions
Exam 18: Confidence Intervals for Proportions56 Questions
Exam 19: Testing Hypotheses About Proportions50 Questions
Exam 20: More About Tests69 Questions
Exam 21: Comparing Two Proportions52 Questions
Exam 22: Inferences About Means106 Questions
Exam 23: Comparing Means43 Questions
Exam 24: Paired Samples and Blocks33 Questions
Exam 25: Comparing Counts78 Questions
Exam 26: Inferences for Regression51 Questions
Exam 27: Analysis of Variance39 Questions
Exam 28: Multifactor Analysis of Variance22 Questions
Exam 29: Multiple Regression22 Questions
Exam 30: Multiple Regression Wisdom21 Questions
Exam 31: Rank-Based Nonparametric Tests29 Questions
Exam 32: The Bootstrap31 Questions
Select questions type
Here are some summary statistics for all of the runners in a local 12 kilometre race:
Slowest time = 124 minutes
Mean = 85 minutes
Median = 85 minutes
Range = 94 minutes
IQR = 56
Q1 = 34
Standard deviation = 13 minutes
Is the distribution symmetric,skewed to the left,or skewed to the right? Explain.
(Multiple Choice)
4.8/5  (35)
(35)
The mathematics department at a community college collected data for the number of students enrolled in 40 math courses over the course of one year.The following stem-and-leaf display shows the total number of students enrolled in each class. 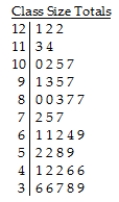 Key:
10 | 5 = 105 students
Key:
10 | 5 = 105 students
(Multiple Choice)
4.8/5 (34)
The weekly salaries (in dollars)of 24 randomly selected employees of a company are shown below,and displayed on the following boxplot. 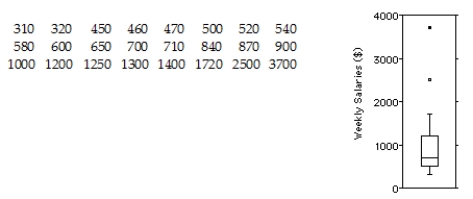 Find the mean and the median.Which is the most appropriate measure of centre?
(Multiple Choice)
4.9/5 (37)
Shown below are the boxplot and the histogram for the highest temperatures ever recorded (in °F)in 32 different states in the U.S.A. 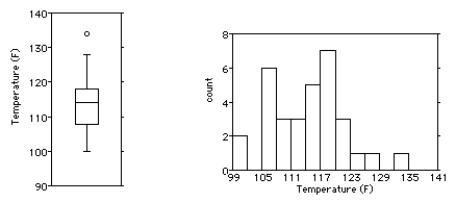 i)What features of the distribution can you see in both the histogram and the boxplot?
ii)What features of the distribution can you see in the histogram that you could not see in the boxplot?
i)What features of the distribution can you see in both the histogram and the boxplot?
ii)What features of the distribution can you see in the histogram that you could not see in the boxplot?
(Multiple Choice)
4.9/5 (36)
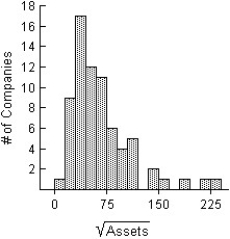
Here is a histogram of the assets (in millions of dollars)of 71 companies. 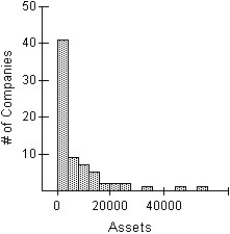 Which of the following is the most appropriate re-expression of these data? Explain.
I II
Which of the following is the most appropriate re-expression of these data? Explain.
I II 
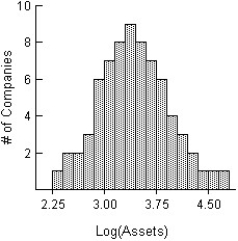 III
III 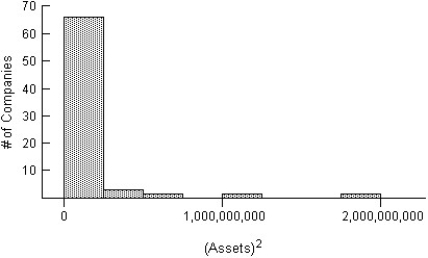
(Multiple Choice)
4.8/5 (29)
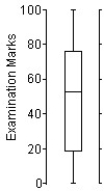
The boxplots display case prices (in dollars)of white wines produced by three vineyards in south-western Ontario.Which vineyard produces the most expensive wine? 
(Multiple Choice)
4.9/5 (36)
The following data consists of the heights,in centimetres,of 15 randomly selected female high school students and 15 randomly selected male high school students.
Women: 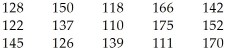 Men:
Men: 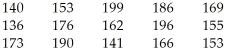 Choose the back-to-back stemplot that represents the given data.
I II III IV
Choose the back-to-back stemplot that represents the given data.
I II III IV 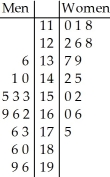
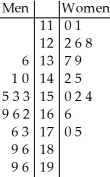
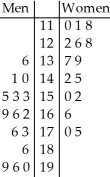
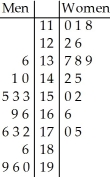 V
V 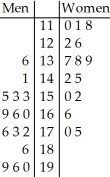
(Multiple Choice)
4.9/5 (29)
The boxplots display case prices (in dollars)of white wines produced by three vineyards in south-western Ontario.Describe these wine prices. 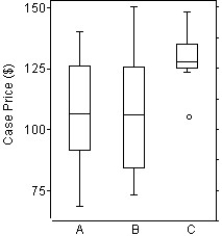
(Multiple Choice)
4.8/5 (39)
Members of the Ontario Field Ornithologists (OFO)observe birds at various locations within the province to see how many different species of bird they can spot.Suppose that 21 members have reported spotting the following number of species in 2009.The lower stem contains leaves with the digits 0-4 and the upper stem contains leaves with digits 5-9. 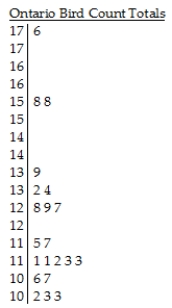 Key:
11 | 5 = 115 birds
Key:
11 | 5 = 115 birds
(Multiple Choice)
4.9/5 (37)
The freethrow percentages for participants in a basketball tournament were compiled.The percents ranged from 31% to 91% with a mean of 63% and a standard deviation of 6%.The quartiles and median percentages were 41%,79%,and 63%.Suppose one participant did not make any of his attempted freethrows (0%).Which of the summary statistics might not change if that data value was added to the distribution?
(Multiple Choice)
4.8/5 (40)
The histograms display the body fat percentages of 42 female students and 48 male students taking a college health course. 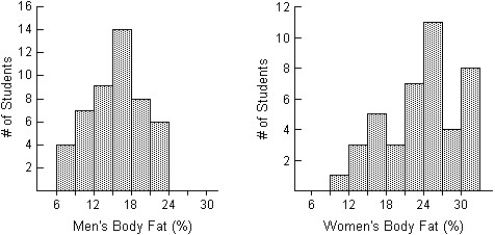 Compare the distributions (shape,centre,spread,unusual features).
(Multiple Choice)
4.9/5 (27)
A small company employs a supervisor at $1,300 a week,an inventory manager at $900 a week,5 stock boys at $400 a week,and 3 drivers at $500 a week.
(Multiple Choice)
4.8/5 (36)
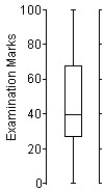
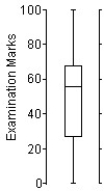
Here is an ogive of the distribution of students' marks on their statistics test. 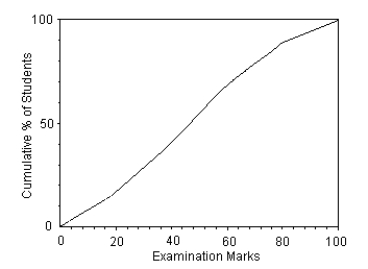 Choose the boxplot that represents the given data.
I II III
Choose the boxplot that represents the given data.
I II III 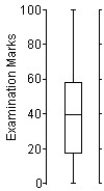
 IV V
IV V 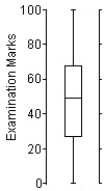
(Multiple Choice)
5.0/5 (29)
Here is a histogram of the assets (in millions of dollars)of 71 companies.The square root re-expression of assets is also given.In the square root re-expression,what does the value 45 actually indicate about the company's assets? 
(Multiple Choice)
4.8/5 (30)
Here is the boxplot and an ogive of the distribution of students marks on their statistics test. 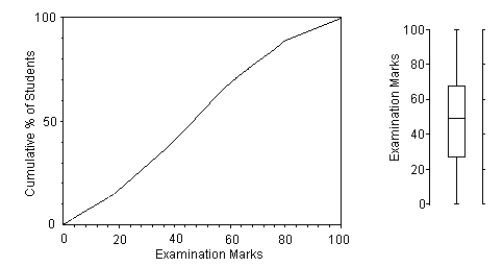 Write a few sentences describing this distribution.
(Multiple Choice)
4.7/5 (36)
Filters
- Essay(0)
- Multiple Choice(0)
- Short Answer(0)
- True False(0)
- Matching(0)