Exam 3: Limits and Continuity
Exam 2: Functions413 Questions
Exam 3: Limits and Continuity327 Questions
Exam 4: Derivatives560 Questions
Exam 5: Applications of Derivatives412 Questions
Exam 6: Integrals292 Questions
Exam 7: Applications of Definite Integrals258 Questions
Exam 8: Integrals and Transcendental Functions176 Questions
Exam 9: Techniques of Integration460 Questions
Exam 10: First-Order Differential Equations90 Questions
Exam 11: Infinite Sequences and Series473 Questions
Exam 12: Parametric Equations and Polar Coordinates396 Questions
Exam 13: Vectors and the Geometry of Space229 Questions
Exam 14: Vector-Valued Functions and Motion in Space142 Questions
Exam 15: Partial Derivatives409 Questions
Exam 16: Multiple Integrals435 Questions
Exam 17: Integrals and Vector Fields277 Questions
Select questions type
Sketch the graph of a function y = f(x) that satisfies the given conditions.
-
(Essay)
4.8/5  (23)
(23)
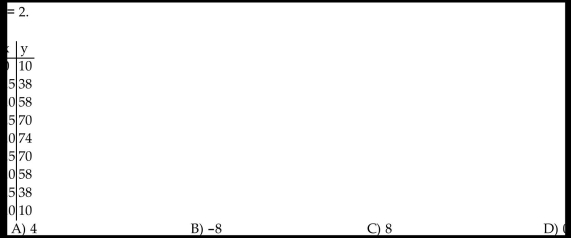
Use the table to estimate the rate of change of y at the specified value of x.
-
(Not Answered)
This question doesn't have any answer yet
Use a CAS to plot the function near the point x0 being approached. From your plot guess the value of the limit.
-Write the formal notation for the principle "the limit of a quotient is the quotient of the limits" and include a statement of any restrictions on the principle.
(Multiple Choice)
5.0/5 (37)
Graph the rational function. Include the graphs and equations of the asymptotes.
-
(Multiple Choice)
5.0/5 (31)
Find the slope of the curve at the given point P and an equation of the tangent line at P.
-
(Multiple Choice)
4.9/5 (36)
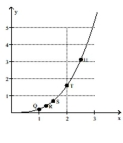
Use the slopes of UQ, UR, US, and UT to estimate the rate of change of y at the specified value of x.
-
(Multiple Choice)
4.9/5 (29)
Divide numerator and denominator by the highest power of x in the denominator to find the limit.
-
(Multiple Choice)
4.7/5 (29)
Graph the rational function. Include the graphs and equations of the asymptotes.
-
(Multiple Choice)
4.9/5 (35)
Find the average rate of change of the function over the given interval.
-
(Multiple Choice)
4.8/5 (33)
Use the slopes of UQ, UR, US, and UT to estimate the rate of change of y at the specified value of x.
-
(Multiple Choice)
4.7/5 (28)
Filters
- Essay(0)
- Multiple Choice(0)
- Short Answer(0)
- True False(0)
- Matching(0)