Exam 10: Inference From Small Samples
Exam 1: Describing Data With Graphs94 Questions
Exam 2: Describing Data With Numerical Measures186 Questions
Exam 3: Describing Bivariate Data35 Questions
Exam 4: Probability and Probability Distributions136 Questions
Exam 5: Several Useful Discrete Distributions129 Questions
Exam 6: The Normal Probability Distribution196 Questions
Exam 7: Sampling Distributions162 Questions
Exam 8: Large-Sample Estimation173 Questions
Exam 9: Large-Sample Tests of Hypotheses210 Questions
Exam 10: Inference From Small Samples261 Questions
Exam 11: The Analysis of Variance156 Questions
Exam 12: Linear Regression and Correlation165 Questions
Exam 13: Multiple Regression Analysis178 Questions
Exam 14: Analysis of Categorical Data136 Questions
Exam 15: Nonparametric Statistics198 Questions
Select questions type
If we are testing for the difference between the means of 2 dependent populations (matched pairs experiment) with samples of  and
and  , the number of degrees of freedom is equal to:
(Multiple Choice)
4.8/5  (38)
(38)
What is the appropriate t critical value for each of the following confidence levels and sample sizes when testing the two-sided alternative hypothesis?
80% confidence, n = 17
______________
90% confidence, n = 7
______________
99% confidence, n = 4
______________
95% confidence, n = 14
______________
(Short Answer)
4.9/5 (35)
The average total SAT scores (verbal plus math) were recorded for two groups of students: one group planning to major in engineering and one group planning to major in language/literature. 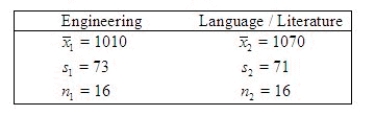 To use the two-sample t test with a pooled estimate of
  you must assume that the two population variances are equal. Test this assumption using the F test for equality of variances using
  = 0.05.
Test Statistic = ______________
Reject Region: Reject H0 if F > ______________
Conclusion: ______________
One ______________ conclude that the variances are different.
What is the approximate p-value for the test?
______________
= 0.05.
Test Statistic = ______________
Reject Region: Reject H0 if F > ______________
Conclusion: ______________
One ______________ conclude that the variances are different.
What is the approximate p-value for the test?
______________
(Short Answer)
4.9/5 (33)
The statistical distribution used for testing the difference between two population variances is the:
(Multiple Choice)
4.8/5 (35)
A random sample of size 9 produced a sample mean equal to 13.5 and a standard deviation of 3.2. The margin of error associated with a 95% confidence interval estimate for the population mean is approximately 2.46.
(True/False)
4.8/5 (43)
A statistician wants to test for the equality of means in two independent samples drawn from normal populations of people enrolled in a diet program. However, he will not perform the equal-variance t-test of the difference between the population means if the condition necessary for its use is not satisfied. The number of pound lost at the completion of the program data follow: 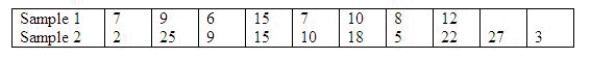 Can the statistician conclude at the 5% significance level that the required condition is not satisfied?
Test statistic = ______________
Critical Value(s) = ______________
Conclusion: ______________
Interpretation: __________________________________________
Estimate with 95% confidence the ratio of the two population variances.
______________
Can the statistician conclude at the 5% significance level that the required condition is not satisfied?
Test statistic = ______________
Critical Value(s) = ______________
Conclusion: ______________
Interpretation: __________________________________________
Estimate with 95% confidence the ratio of the two population variances.
______________
(Short Answer)
4.8/5 (33)
It is of interest to a Harley Davidson dealer to know the average gas mileage of a 1992 XLT. A random sample of 17 was taken from a normally distributed population and produced a mean of 52 miles per gallon and a standard deviation of 4.1 miles per gallon. Construct a 95 percent confidence interval for the mean gas mileage of any 1992 Harley Davidson XLT. Interpret the interval in part (a). The dealer claims that the average gas mileage of Harley Davidson 1992 XLT is 58 miles per gallon Based on the interval in part (a), can this claim be rejected? Justify your answer.
a. What is the 95% confidence interval (CI)?
CI = ______________ Enter (n1, n2)
Interpret the interval:
________________________________________________________
The claim ______________ be rejected.
Justify your answer
(Short Answer)
4.9/5 (37)
Assume that the population distributions of times (in minutes) for two different skiers to race the same course are normal with equal variances. Two random samples, drawn independently from the populations, showed the following statistics.  Construct and interpret a 95% confidence interval for the true difference in average time of skiers to race the same course.
What is the 95% confidence interval? (CI)
CI = ______________ Enter (n1, n2)
The sample evidence ______________ support that the two skiers, on average, have different race times.
Construct and interpret a 95% confidence interval for the true difference in average time of skiers to race the same course.
What is the 95% confidence interval? (CI)
CI = ______________ Enter (n1, n2)
The sample evidence ______________ support that the two skiers, on average, have different race times.
(Short Answer)
4.9/5 (45)
The variability in a scientist's measuring equipment was observed for a random sample of 26 test runs from a normal distribution. The sample yielded a variance of 33. Estimate the population variance using a 95% confidence interval.
______________ Enter (n1, n2)
(Short Answer)
4.8/5 (40)
Which of the following statements is true with respect to the t distribution?
(Multiple Choice)
4.8/5 (38)
A Marine drill instructor recorded the time in which each of 10 recruits completed an obstacle course both before and after basic training. To test whether any improvement occurred, the instructor would use a t-distribution with 9 degrees of freedom.
(True/False)
4.8/5 (35)
If a sample of size 15 is randomly selected from a population, the value of A for the probability P(t  A) = 0.01 is 2.602.
(True/False)
4.8/5 (42)
The test scores on a 100-point test were recorded for 20 students: 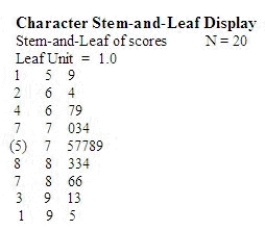 Can you reasonably assume that these test scores have been selected from a normal population? Use a stem and leaf plot to justify your answer. Calculate the mean and standard deviation of the scores. If these students can be considered a random sample from the population of all students, find a 95% confidence interval for the average test score in the population.
These test scores ______________ been selected from a normal population.
Mean = ______________
Standard Deviation = ______________
What is 95% confidence interval? (CI)
CI = ______________ Enter (n1, n2)
Can you reasonably assume that these test scores have been selected from a normal population? Use a stem and leaf plot to justify your answer. Calculate the mean and standard deviation of the scores. If these students can be considered a random sample from the population of all students, find a 95% confidence interval for the average test score in the population.
These test scores ______________ been selected from a normal population.
Mean = ______________
Standard Deviation = ______________
What is 95% confidence interval? (CI)
CI = ______________ Enter (n1, n2)
(Short Answer)
4.8/5 (34)
A race car driver tested his car for time from 0 to 60 mph, and in 20 tests obtained an average of 48.5 seconds with a standard deviation of 1.47 seconds. A 95% confidence interval for the 0 to 60 time is 4.52 seconds to 5.18 seconds.
(True/False)
4.8/5 (34)
Given the information:  ,
,  ,
,  ,
,  , the number of degrees of freedom that should be used in the pooled-variance t test is:
(Multiple Choice)
4.7/5 (42)
A customer was interested in comparing the top speed (in miles per hour) of two models of snowmobiles. The customer selected two independent random samples of the snowmobiles and calculated the following summary information: 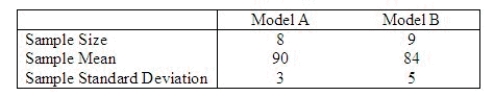 Assume the distribution of top speeds is approximately normal. Is it reasonable to assume equality of variances in this problem?
______________
Calculate the value of the test statistic.
______________
Test whether there is a significant difference in average top speed between the two models of snowmobiles.
Conclusion: ________________________________________________________
Assume the distribution of top speeds is approximately normal. Is it reasonable to assume equality of variances in this problem?
______________
Calculate the value of the test statistic.
______________
Test whether there is a significant difference in average top speed between the two models of snowmobiles.
Conclusion: ________________________________________________________
(Essay)
4.8/5 (45)
An automatic coffee vending machine dispenses a different amount of coffee in ounces for each cup. Assume the nine measurements below were taken from a population with a normal distribution.
6.5, 6.0, 6.9, 6.2, 6.1, 6.6, 6.8, 6.0, 6.1
Construct an 80% confidence interval for the mean amount of ounces that is dispensed for all cups of coffee from this machine. Interpret the interval in part (a).
a. What is the 80% confidence interval (CI)?
CI = ______________ Enter (n1, n2)
Interpret the interval:
________________________________________________________
(Essay)
4.8/5 (33)
The sampling distribution of the ratio of two sample variances  is said to be F distributed provided that:
(Multiple Choice)
4.8/5 (34)
In testing the equality of two population variances, when the populations are normally distributed, the 5% level of significance has been used. To determine the rejection region, you will refer to the F table corresponding to an upper-tail area of 0.025.
(True/False)
5.0/5 (34)
Filters
- Essay(0)
- Multiple Choice(0)
- Short Answer(0)
- True False(0)
- Matching(0)