Exam 10: Inference From Small Samples
Exam 1: Describing Data With Graphs94 Questions
Exam 2: Describing Data With Numerical Measures186 Questions
Exam 3: Describing Bivariate Data35 Questions
Exam 4: Probability and Probability Distributions136 Questions
Exam 5: Several Useful Discrete Distributions129 Questions
Exam 6: The Normal Probability Distribution196 Questions
Exam 7: Sampling Distributions162 Questions
Exam 8: Large-Sample Estimation173 Questions
Exam 9: Large-Sample Tests of Hypotheses210 Questions
Exam 10: Inference From Small Samples261 Questions
Exam 11: The Analysis of Variance156 Questions
Exam 12: Linear Regression and Correlation165 Questions
Exam 13: Multiple Regression Analysis178 Questions
Exam 14: Analysis of Categorical Data136 Questions
Exam 15: Nonparametric Statistics198 Questions
Select questions type
Which of the following distributions is used in testing  vs.
vs. 
(Multiple Choice)
5.0/5  (29)
(29)
If a hypothesis test is to be conducted regarding a population variance, then the critical value of the test will be obtained using the:
(Multiple Choice)
4.8/5 (35)
A test is being conducted to test the difference between two population means using data that are gathered from a matched pairs experiment. If the paired differences are normal, then the distribution used for testing is the:
(Multiple Choice)
4.8/5 (35)
Suppose that a t-test is being conducted at the 0.05 level of significance to test  vs.
vs.  . A sample of size 20 is randomly selected. The rejection region is:
(Multiple Choice)
4.9/5 (47)
Two independent samples are selected at random from two normal populations. The sample statistics are as follows: 


 and
and  Assume that a two-tailed hypothesis test is conducted at
  , what is the value of the test statistic?
(Multiple Choice)
4.8/5 (42)
If a sample has 18 observations and a 90% confidence estimate for  is needed, the appropriate t-score is 1.740.
(True/False)
4.9/5 (44)
A political analyst in Iowa surveys a random sample of registered Democrats and compares the results with those obtained from a random sample of registered Republicans. This would be an example of two independent samples.
(True/False)
4.9/5 (39)
In a one-tailed test of the equality of two population variances, the F-test statistic is calculated by placing the larger sample variance in the numerator.
(True/False)
4.8/5 (33)
The t-distribution approaches the normal distribution as the number of degrees of freedom increases.
(True/False)
4.8/5 (36)
The number of degrees of freedom associated with the t-test, when the data are gathered from a matched pairs experiment with 8 pairs, is 7.
(True/False)
4.8/5 (40)
A random sample of size 10 produced a sample mean equal to 12 and a standard deviation equal to .15. Based on this information, the upper limit for a 95% confidence interval estimate is approximately 12.107.
(True/False)
4.9/5 (44)
One reason for performing a paired-difference experiment is to:
(Multiple Choice)
4.7/5 (32)
A scientist is testing two different types of Secchi discs. This is an instrument used for determining water clarity. The scientist takes a depth reading (in feet below the surface) with each disc at 8 different locations on a lake. The results of the 8 different locations for each Secchi disc are listed below. 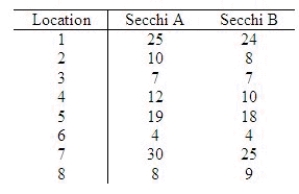 Assume the two population distributions are normal. Determine if there is a significant difference in average depth reading for the two discs. Use a significance level of
  = 0.01.
Use the Data Analysis software if you prefer.
Test Statistic = ______________
Reject Region: Reject H0 if |t| > ______________
Conclusion: ______________
The sample evidence supports that the two discs ______________.
= 0.01.
Use the Data Analysis software if you prefer.
Test Statistic = ______________
Reject Region: Reject H0 if |t| > ______________
Conclusion: ______________
The sample evidence supports that the two discs ______________.
(Short Answer)
4.9/5 (40)
A logger knows the average time for his cutting machine to cut 20 trees is 9.8 minutes. A new machine on the market claims to cut the trees in less than 9.8 minutes. A random sample of 25 test runs on the new machine yielded a mean of 8.5 minutes with a standard deviation of 1.5. Does the sample data suggest the new machine cuts faster than the logger's machine? Test at the  = 0.05 level. Assume the cutting time is normally distributed and interpret your results.
Test Statistic = ______________
____________________________
The new machine ______________ cut faster than the logger's machine.
= 0.05 level. Assume the cutting time is normally distributed and interpret your results.
Test Statistic = ______________
____________________________
The new machine ______________ cut faster than the logger's machine.
(Short Answer)
4.9/5 (36)
A car salesperson tries to convince customers buying a new Honda Accord that the gas mileage varies by only  2 miles per gallon when driving in town and on the highway. The customer found, for 14 randomly chosen tanks of gas, the gas mileage to vary by
  2.8 miles per gallon. Do the customer's results contradict the salesperson's claim? Test the relevant hypotheses at the 0.05 level of significance. Assume the sample comes from a normal population.
Test Statistic = ______________
Reject Region: Reject H0 if
2.8 miles per gallon. Do the customer's results contradict the salesperson's claim? Test the relevant hypotheses at the 0.05 level of significance. Assume the sample comes from a normal population.
Test Statistic = ______________
Reject Region: Reject H0 if  > ______________
Conclusion: ______________
Interpretation: ________________________________________________________
> ______________
Conclusion: ______________
Interpretation: ________________________________________________________
(Essay)
4.8/5 (38)
In testing the difference between two population means using two independent samples, the population standard deviations are assumed to be known, and the calculated test statistic equals 2.75. If the test is two-tail and 5% level of significance has been specified, the conclusion should not be reject the null hypothesis.
(True/False)
4.8/5 (40)
The t-test for the difference between the means of two independent populations assumes that the respective:
(Multiple Choice)
4.8/5 (38)
Filters
- Essay(0)
- Multiple Choice(0)
- Short Answer(0)
- True False(0)
- Matching(0)