Exam 10: Inference From Small Samples
Exam 1: Describing Data With Graphs94 Questions
Exam 2: Describing Data With Numerical Measures186 Questions
Exam 3: Describing Bivariate Data35 Questions
Exam 4: Probability and Probability Distributions136 Questions
Exam 5: Several Useful Discrete Distributions129 Questions
Exam 6: The Normal Probability Distribution196 Questions
Exam 7: Sampling Distributions162 Questions
Exam 8: Large-Sample Estimation173 Questions
Exam 9: Large-Sample Tests of Hypotheses210 Questions
Exam 10: Inference From Small Samples261 Questions
Exam 11: The Analysis of Variance156 Questions
Exam 12: Linear Regression and Correlation165 Questions
Exam 13: Multiple Regression Analysis178 Questions
Exam 14: Analysis of Categorical Data136 Questions
Exam 15: Nonparametric Statistics198 Questions
Select questions type
In testing for the equality of two population variances, when the populations are normally distributed, the 5% level of significance has been used. To determine the rejection region, it will be necessary to refer to the F table corresponding to an upper-tail area of 0.05.
(True/False)
4.8/5  (30)
(30)
Assume that the population distributions of life expectancy (in years) of men and women are normal with equal variances. Two random samples, drawn independently from the populations, showed the following statistics. 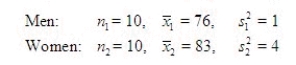 Construct and interpret a 99% confidence interval for the true difference in average life expectancy of men and women.
What is the 99% confidence interval? (CI)
CI = ______________ Enter (n1, n2)
Since this interval does not contain zero, the sample evidence ______________ support that men and women have, on average, different life expectancies..
Construct and interpret a 99% confidence interval for the true difference in average life expectancy of men and women.
What is the 99% confidence interval? (CI)
CI = ______________ Enter (n1, n2)
Since this interval does not contain zero, the sample evidence ______________ support that men and women have, on average, different life expectancies..
(Short Answer)
4.8/5 (32)
We can use either the z-test or the t-test to determine whether two population variances are equal.
(True/False)
4.7/5 (30)
The value of F that locates an area 0.01 in the upper tail of the F-distribution for  = 15 and
  = 10 is 3.80.
(True/False)
4.9/5 (39)
If you wish to estimate with 95% confidence the average number of miles that students living off-campus commute to classes every day, a random sample of 20 students produced a mean equal to 5.2 miles and a standard deviation of 3.05 miles. Then the point estimate for the true population mean is:
(Multiple Choice)
4.8/5 (42)
In testing the difference between two population means using two independent samples, the sampling distribution of the sample mean difference  is normal if the sample sizes are both greater than 30.
(True/False)
4.7/5 (32)
For a given level of significance, increasing the sample size will tend to increase the chi-square critical value used in testing the null hypothesis about a population variance.
(True/False)
4.8/5 (35)
The grades of a sample of 10 students, selected at random from a large population, are 71, 86, 75, 63, 92, 70, 81, 59, 80, and 90.
Compute the sample variance.
______________
Construct a 90% confidence interval estimate for the population variance.
______________
Construct a 90% confidence interval estimate for the population standard deviation.
______________
Can we infer at the 90% confidence that the population variance is significantly less than 100?
Test statistic = ______________
Critical Value(s) = ______________
Conclusion: ______________
Interpretation: __________________________________________
(Short Answer)
4.7/5 (32)
In testing the difference between two population means using two independent samples, we use the pooled variance in estimating the standard error of the sampling distribution of the sample mean difference  if the populations are normal with equal variances.
(True/False)
4.9/5 (29)
The sampling distribution of the statistic  ) is the t distribution only if the sample is drawn from:
(Multiple Choice)
4.7/5 (36)
An aircraft manufacturer requires bolts that are part of the landing gear assembly to have a mean diameter of 1.1 inches with a variance of no more than 0.04 inches2. The bolts are purchased from an outside supplier. A random sample of 30 bolts from a recently received shipment yielded a variance of 0.054 inches2. Should the shipment be returned? Perform the appropriate test of hypothesis using  = 0.05.
Test Statistic = ______________
Reject Region: Reject H0 if
= 0.05.
Test Statistic = ______________
Reject Region: Reject H0 if  > ______________
Conclusion: ______________
Conclusion: ______________
> ______________
Conclusion: ______________
Conclusion: ______________
(Short Answer)
5.0/5 (33)
When the necessary conditions are met, a two-tail test is being conducted at  = 0.05 to test
  . The two sample variances are
 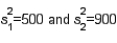 , and the sample sizes are
 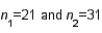 . The rejection region is F > 2.16 or F < 0.4347
(True/False)
4.8/5 (31)
The t-distribution allows the calculation of confidence intervals for means when the actual standard error is not known.
(True/False)
4.9/5 (38)
The 5th percentile of a chi-squared distribution with 10 degrees of freedom is equal to 4.3903.
(True/False)
4.8/5 (39)
In constructing a confidence interval estimate for the difference between the means of two normally distributed populations, using two independent samples, we:
(Multiple Choice)
4.8/5 (35)
A paired-difference experiment was conducted using 10 people who followed a diet program for 4 weeks. Their weights before and after the program were recorded. Test the null hypothesis H0:  = 0 vs. H1:
  0 for
0 for  = 0.05,
  = 0.35, and sd2 = 0.18. Give the approximate p-value for the test.
Use the Data Analysis software if you prefer.
Test statistic = ______________
The p-value is between ______________.
Conclusion: ______________
Find a 95% confidence interval for
= 0.35, and sd2 = 0.18. Give the approximate p-value for the test.
Use the Data Analysis software if you prefer.
Test statistic = ______________
The p-value is between ______________.
Conclusion: ______________
Find a 95% confidence interval for  .
______________
.
______________
(Short Answer)
4.8/5 (41)
A faculty advisor was interested in determining whether there is a difference in the amount of time (in hours) spent studying on weeknights (Monday through Thursday) between male and female students. The advisor selected a sample of 12 female students and a second independent sample of 10 male students and asked each student to indicate the average amount of time they spend studying on a weeknight. The following summary statistics are obtained. 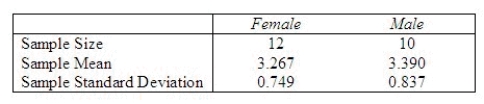 The advisor assumed equal variances in the analysis. Is this a reasonable assumption? Perform the appropriate test of hypothesis to determine whether there is a significant difference in average time spent studying on weeknights between male and female students Test using
  = 0.05.
Approximate the p-value for the test in part (c). Using the p-value approach and
= 0.05.
Approximate the p-value for the test in part (c). Using the p-value approach and  = 0.10, what conclusion can be drawn about the difference in average time spent studying on weeknights between male and female students? Develop a 95% confidence interval for the average amount of time spent studying on week nights by females.
Test Statistic = ______________
Reject Region: Reject H0 if |t| > ______________
Conclusion: ______________
One ______________ conclude that there is a significant difference in average time spent studying on weeknights between male and female students.
P-value = ______________
Using the p-value approach, one ______________ conclude there is a significant difference in average time spent studying on weeknights between male and female students.
What is the 95% confidence interval? (CI)
CI = ______________ Enter (n1, n2)
= 0.10, what conclusion can be drawn about the difference in average time spent studying on weeknights between male and female students? Develop a 95% confidence interval for the average amount of time spent studying on week nights by females.
Test Statistic = ______________
Reject Region: Reject H0 if |t| > ______________
Conclusion: ______________
One ______________ conclude that there is a significant difference in average time spent studying on weeknights between male and female students.
P-value = ______________
Using the p-value approach, one ______________ conclude there is a significant difference in average time spent studying on weeknights between male and female students.
What is the 95% confidence interval? (CI)
CI = ______________ Enter (n1, n2)
(Short Answer)
4.9/5 (37)
The "shape" of the t-distribution changes as the value of the sample mean changes.
(True/False)
4.9/5 (34)
The F-distribution is the sampling distribution of the ratio of:
(Multiple Choice)
4.7/5 (32)
Filters
- Essay(0)
- Multiple Choice(0)
- Short Answer(0)
- True False(0)
- Matching(0)