Exam 10: Inference From Small Samples
Exam 1: Describing Data With Graphs94 Questions
Exam 2: Describing Data With Numerical Measures186 Questions
Exam 3: Describing Bivariate Data35 Questions
Exam 4: Probability and Probability Distributions136 Questions
Exam 5: Several Useful Discrete Distributions129 Questions
Exam 6: The Normal Probability Distribution196 Questions
Exam 7: Sampling Distributions162 Questions
Exam 8: Large-Sample Estimation173 Questions
Exam 9: Large-Sample Tests of Hypotheses210 Questions
Exam 10: Inference From Small Samples261 Questions
Exam 11: The Analysis of Variance156 Questions
Exam 12: Linear Regression and Correlation165 Questions
Exam 13: Multiple Regression Analysis178 Questions
Exam 14: Analysis of Categorical Data136 Questions
Exam 15: Nonparametric Statistics198 Questions
Select questions type
A food processor wants to compare two preservatives for their effects on retarding spoilage. Suppose 16 cuts of fresh meat are treated with preservative A and 16 are treated with preservative B, and the number of hours until spoilage begins is recorded for each of the 32 cuts of meat. The results are summarized in the table below: 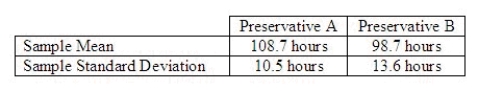 Test to determine if the average number of hours until spoilage begins differs for the preservatives A and B. Determine the rejection region at
  = 0.05 and write the proper conclusion.
Test statistic = ______________
Critical Value(s) = ______________
Conclusion: ______________
Interpretation: __________________________________________
= 0.05 and write the proper conclusion.
Test statistic = ______________
Critical Value(s) = ______________
Conclusion: ______________
Interpretation: __________________________________________
(Essay)
4.8/5  (42)
(42)
The t-distribution with n - 1 degrees of freedom is used when testing a null hypothesis for a population variance.
(True/False)
4.8/5 (40)
For an F-distribution, the number of degrees of freedom for the denominator:
(Multiple Choice)
4.7/5 (40)
The printing time of a weekly magazine was studied using two different machines,  and
and  . Eight different magazines were randomly assigned to each of the two printing machines, and produced standard deviations
  = 2.08, and
  = 1.66 for machines
  and
and  , respectively. Assume the required assumptions are met and use
  = 0.05 to determine if the variances for the two machines are different.
Test Statistic = ______________
Reject Region: Reject H0 if F > ______________
Conclusion: ______________
There is ______________ to indicate a difference in the population variances.
= 0.05 to determine if the variances for the two machines are different.
Test Statistic = ______________
Reject Region: Reject H0 if F > ______________
Conclusion: ______________
There is ______________ to indicate a difference in the population variances.
(Short Answer)
4.7/5 (33)
As the degrees of freedom for the t-distribution increase, the distribution approaches the:
(Multiple Choice)
4.9/5 (33)
A random sample of size n = 7 from a normal population produced these measurements:
2.1, 4.3, 2.4, 2.7, 4.0, 3.5, 3.6.
Calculate the sample variance,  .
______________
Construct a 95% confidence interval (CI) for the population variance,
.
______________
Construct a 95% confidence interval (CI) for the population variance,  .
CI = ______________ Enter (n1, n2)
Test
.
CI = ______________ Enter (n1, n2)
Test 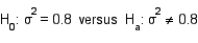 using
using  = 0.05. State your conclusions.
Test Statistic = ______________
Critical Value(s) = ______________
Conclusion: ______________
There is ______________ to indicate that
= 0.05. State your conclusions.
Test Statistic = ______________
Critical Value(s) = ______________
Conclusion: ______________
There is ______________ to indicate that  is different from 0.8.
What is the approximate p-value for the test in part (c)?
______________
is different from 0.8.
What is the approximate p-value for the test in part (c)?
______________
(Short Answer)
4.8/5 (29)
If you wish to test the difference between the means of two-paired populations with samples of size 15 each, then the appropriate degrees of freedom is equal to:
(Multiple Choice)
4.9/5 (41)
In testing  vs.
vs.  the following sample data were recorded: 5.0, 6.1, and 11.1. Then, the value of the test statistic is:
(Multiple Choice)
4.9/5 (42)
The mean driving times (in minutes) on 5 different days for Abby and Steve to drive to their classes at Michigan State University are listed below. 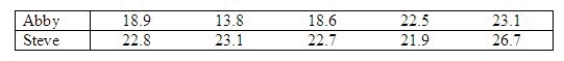 Is there sufficient evidence to conclude that the mean driving times for both students differ? Assume the population distributions are normal and have equal variances. Use a 0.01 significance level.
Test Statistic = ______________
Reject Region: Reject H0 if |t| > ______________
Conclusion: ______________
There ______________ enough evidence to conclude that the driving times for Abby and Steve differ.
Is there sufficient evidence to conclude that the mean driving times for both students differ? Assume the population distributions are normal and have equal variances. Use a 0.01 significance level.
Test Statistic = ______________
Reject Region: Reject H0 if |t| > ______________
Conclusion: ______________
There ______________ enough evidence to conclude that the driving times for Abby and Steve differ.
(Short Answer)
4.8/5 (45)
A social worker was interested in determining whether there is a significant difference in the average monthly cost per child for childcare outside the home between state supported facilities and privately owned facilities. Two independent random samples yielded the following information:  Is it reasonable to assume equality of variances in this problem? Justify your answer. Perform the appropriate test of hypothesis to determine whether there is a significant difference in the average monthly cost per child for childcare between the two types of facilities. Use
  .
Test Statistic = ______________
Reject Region: Reject H0 if |t| > ______________
Conclusion: ______________
One ______________ conclude that there is a significant difference in the average monthly cost per child for childcare outside the home between the two types of facilities.
.
Test Statistic = ______________
Reject Region: Reject H0 if |t| > ______________
Conclusion: ______________
One ______________ conclude that there is a significant difference in the average monthly cost per child for childcare outside the home between the two types of facilities.
(Short Answer)
4.8/5 (29)
Two soft drink machines dispense liquids of 10 ounces, on the average. The question is whether the two machines are equally consistent (i.e., equally variable) in the dispensing of the liquid. To answer this question, a sample of size 10 was obtained from each machine and the sample standard deviations were computed to be  = 1.87 ounces and
  = 1.25 ounces. Perform the appropriate test for equality of variances using
  = 0.05.
Test Statistic = ______________
Reject Region: Reject H0 if F> ______________
Conclusion: ______________
One ______________ conclude that there is a significant difference in the variability of liquid dispensed between the two machines.
= 0.05.
Test Statistic = ______________
Reject Region: Reject H0 if F> ______________
Conclusion: ______________
One ______________ conclude that there is a significant difference in the variability of liquid dispensed between the two machines.
(Short Answer)
4.7/5 (30)
In order to determine the p-value associated with hypothesis testing about the population mean  , it is necessary to know the value of the test statistic.
(True/False)
4.8/5 (36)
In testing for the equality of two population variances, when the populations are normally distributed, the 10% level of significance has been used. To determine the rejection region, it will be necessary to refer to the F table corresponding to an upper-tail area of:
(Multiple Choice)
4.9/5 (30)
A simple random sample of 100 grocery receipts was drawn from a normal population. The mean and standard deviation of the sample were $120 and $25, respectively. Test the hypotheses H0:  = 125 vs. H1:
  125 at the 10% significance level.
Test statistic = ______________
Critical Value(s) = ______________
Conclusion: ______________
Interpretation: ____________________________
Estimate the population mean with 90% confidence.
______________
125 at the 10% significance level.
Test statistic = ______________
Critical Value(s) = ______________
Conclusion: ______________
Interpretation: ____________________________
Estimate the population mean with 90% confidence.
______________
(Short Answer)
4.9/5 (29)
A financial analyst is concerned with the risk associated with a portfolio of stocks. She draws a random sample of nine monthly returns (expressed as a percentage of the initial investment). These data follow: 2, 5, -6, 10, 1, 2, -3, 0, and 7. Find a 95% confidence interval estimate of the population variance.
______________
(Short Answer)
4.8/5 (36)
Two independent samples sizes 20 and 30 are randomly selected from two normally distributed populations. Assume that the population variances are unknown but equal. To test the difference between the population means,  , the sampling distribution of the sample mean difference,
  , is:
, is:
(Multiple Choice)
4.7/5 (39)
The test statistic employed to test  is
is  , which is F distributed with
 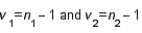 degrees of freedom, provided that the two populations are F distributed.
(True/False)
4.9/5 (45)
A new runner has decided to purchase a new pair of running shoes. He has narrowed his choices to two brands, each of which would be appropriate for his use. His concern is whether there is a significant difference in the average wear between the two brands of shoes. He enlists a random sample of 6 veteran runners to test the shoes. Each runner wore each brand of shoe until it wore out. The following data was recorded, representing the number of weeks each runner used each pair of shoes:
Runner 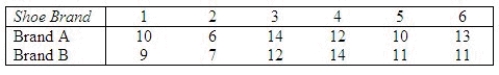 The new runner used a paired-difference t-test for the analysis. Is this method appropriate? Justify your answer.
________________________________________________________
Perform the appropriate test of hypothesis to determine whether there is a significant difference in the average wear between the two brands of shoes. Use the 5% level of significance.
Use the Data Analysis software if you prefer.
Test Statistic = ______________
Reject Region: Reject H0 if |t| > ______________
Conclusion: ______________
One ______________ that there is a significant difference in average wear length between the two brands of shoes Find a 95% confidence interval (CI) for the difference in average wear length between the two brands of shoes.
CI = ______________ Enter (n1, n2)
Based on this interval, one ______________ that there is a significant difference in average wear length between the two brands of shoes.
The new runner used a paired-difference t-test for the analysis. Is this method appropriate? Justify your answer.
________________________________________________________
Perform the appropriate test of hypothesis to determine whether there is a significant difference in the average wear between the two brands of shoes. Use the 5% level of significance.
Use the Data Analysis software if you prefer.
Test Statistic = ______________
Reject Region: Reject H0 if |t| > ______________
Conclusion: ______________
One ______________ that there is a significant difference in average wear length between the two brands of shoes Find a 95% confidence interval (CI) for the difference in average wear length between the two brands of shoes.
CI = ______________ Enter (n1, n2)
Based on this interval, one ______________ that there is a significant difference in average wear length between the two brands of shoes.
(Short Answer)
4.8/5 (33)
When the necessary conditions are met, a two-tail test is being conducted at  = 0.05 to test
  . The two sample variances are
 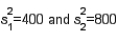 , and the sample sizes are
 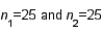 . The calculated value of the test statistic will be F = 2.
(True/False)
4.8/5 (43)
Filters
- Essay(0)
- Multiple Choice(0)
- Short Answer(0)
- True False(0)
- Matching(0)