Exam 10: Inference From Small Samples
Exam 1: Describing Data With Graphs94 Questions
Exam 2: Describing Data With Numerical Measures186 Questions
Exam 3: Describing Bivariate Data35 Questions
Exam 4: Probability and Probability Distributions136 Questions
Exam 5: Several Useful Discrete Distributions129 Questions
Exam 6: The Normal Probability Distribution196 Questions
Exam 7: Sampling Distributions162 Questions
Exam 8: Large-Sample Estimation173 Questions
Exam 9: Large-Sample Tests of Hypotheses210 Questions
Exam 10: Inference From Small Samples261 Questions
Exam 11: The Analysis of Variance156 Questions
Exam 12: Linear Regression and Correlation165 Questions
Exam 13: Multiple Regression Analysis178 Questions
Exam 14: Analysis of Categorical Data136 Questions
Exam 15: Nonparametric Statistics198 Questions
Select questions type
A random sample of size 10 produced a sample mean equal to 12 and a standard deviation equal to .15. Based on this information, the margin of error associated with a 90% confidence interval estimate for the population mean is 1.8331.
(True/False)
4.8/5  (37)
(37)
The sampling distribution of the ratio of two independent sample variances selected randomly from normal populations with equal variances is:
(Multiple Choice)
4.8/5 (38)
Consider the hypotheses H0:  = 20 vs. H1:
  > 20. Assume that math scores on a 25-point quiz for a random sample of 5 students were drawn from a normal population. These were: 18, 16, 10, 13, and 23. Test the hypotheses at the 10% significance level.
Test statistic = ______________
Critical Value(s) = ______________
Conclusion: ______________
Interpretation: ____________________________
Estimate the population variance with 90% confidence.
______________
> 20. Assume that math scores on a 25-point quiz for a random sample of 5 students were drawn from a normal population. These were: 18, 16, 10, 13, and 23. Test the hypotheses at the 10% significance level.
Test statistic = ______________
Critical Value(s) = ______________
Conclusion: ______________
Interpretation: ____________________________
Estimate the population variance with 90% confidence.
______________
(Short Answer)
4.8/5 (36)
A child psychologist was interested in the difference in age (in years) between a boy and girl when they first learn to ride a two-wheeled bicycle. The psychologist developed a 99% confidence interval for the difference in average ages to be (-0.58, 0.73). What conclusion, if any, can be drawn from this interval?
Since 0 is included in the interval, one ______________ conclude there is a difference in age, on the average, at which boys and girls first learn to ride a two-wheeled bicycle.
(Short Answer)
4.9/5 (44)
If you wish to estimate with 95% confidence the average number of miles that students living off-campus commute to classes every day, a random sample of 20 students produced a mean equal to 5.2 miles and a standard deviation of 3.05 miles. Then, the upper limit for a 95% confidence interval estimate for the true population mean is approximately:
(Multiple Choice)
4.8/5 (27)
Two samples of sizes 25 and 35 are independently drawn from two normal populations, where the unknown population variances are assumed to be equal. The number of degrees of freedom of the equal-variances t-test statistic is:
(Multiple Choice)
4.8/5 (31)
In testing  vs.
vs.  , which of the following statements is true?
(Multiple Choice)
4.9/5 (36)
Two samples of sizes 15 and 20 are randomly and independently selected from two normally distributed populations, where the unknown population variances are assumed to be equal. The number of degrees of freedom associated with the two-sample t-test is equal to 35.
(True/False)
4.8/5 (41)
The statistic  ) when the sampled population is normal is Student t distributed with n degrees of freedom.
(True/False)
4.8/5 (38)
In what type of test is the variable of interest the difference between the values of the observations rather than the observations themselves?
(Multiple Choice)
4.8/5 (37)
One study revealed that the average child under the age of 10 watches television 4.5 hours per day.
a. A group of families from a certain community would like to believe that their children watch television less than the national average.
A random sample of 14 children from the community yielded a mean of 4.1 hours per day with a standard deviation of 1.2. Test the appropriate hypotheses at the
 = 0.01 level. Assume the viewing time is normally distributed and interpret your results.
b. Compute the test statistic for the hypotheses in (a).
Test Statistic = ______________
Conclusion: ______________
The sample data ______________ support the null hypothesis at the
= 0.01 level. Assume the viewing time is normally distributed and interpret your results.
b. Compute the test statistic for the hypotheses in (a).
Test Statistic = ______________
Conclusion: ______________
The sample data ______________ support the null hypothesis at the
 level?
(Short Answer)
4.7/5 (41)
The sample size in each independent sample must be the same if we are to test for differences between the means of 2 independent populations.
(True/False)
5.0/5 (44)
When the necessary conditions are met, a two-tail test is being conducted to test the difference between two population means, but your statistical software provides only a one-tail area of 0.045 as part of its output. The p-value for this test will be 0.09.
(True/False)
4.8/5 (35)
The sampling distribution of  is normal if the sampled populations are normal, and approximately normal if the populations are nonnormal and the sample sizes
  and
and  are large.
(True/False)
4.8/5 (42)
The average gas mileage of a 4-wheel drive truck is 18.2 miles per gallon. The average gas mileage for 7 randomly selected trucks are listed below. 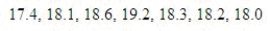 a. Assume the gas mileage distribution is normal. It is of interest to know if the sample data suggest the average gas mileage is different from 18.2 miles per gallon.
b. Compute the test statistic for the hypotheses in (a).
Test Statistic = ______________
c. Compute the approximate p-value associated with the test statistic in (b).
P-Value = ______________
d. Does the sample data support the null hypothesis at the
a. Assume the gas mileage distribution is normal. It is of interest to know if the sample data suggest the average gas mileage is different from 18.2 miles per gallon.
b. Compute the test statistic for the hypotheses in (a).
Test Statistic = ______________
c. Compute the approximate p-value associated with the test statistic in (b).
P-Value = ______________
d. Does the sample data support the null hypothesis at the
 = 0.05 level?
______________
= 0.05 level?
______________
(Short Answer)
4.9/5 (35)
Assume that the population distributions of times (in hours) of two different surgeries are normal with equal variances. Two random samples, drawn independently from the populations, showed the following statistics. 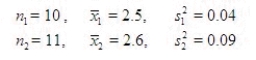 Construct and interpret a 90% confidence interval for the true difference in mean amount of time of the two surgeries.
What is the 90% confidence interval? (CI)
CI = ______________ Enter (n1, n2)
Since this interval contains zero, the sample evidence ______________support that the two surgeries, on average, do not take significantly different amounts of time.
Construct and interpret a 90% confidence interval for the true difference in mean amount of time of the two surgeries.
What is the 90% confidence interval? (CI)
CI = ______________ Enter (n1, n2)
Since this interval contains zero, the sample evidence ______________support that the two surgeries, on average, do not take significantly different amounts of time.
(Short Answer)
4.8/5 (33)
For a sample of size 20 taken from a normally distributed population with standard deviation equal to 5, a 90% confidence interval for the population mean would require the use of:
(Multiple Choice)
4.9/5 (31)
When comparing two population variances, we use the ratio  rather than the difference
  .
.
(True/False)
4.7/5 (37)
If you were constructing a 99% confidence interval of the population mean based on a sample of n = 25 where the standard deviation of the sample s = 0.05, the critical value of t will be:
(Multiple Choice)
4.8/5 (40)
Two independent samples of sizes 25 and 35 are randomly selected from two normal populations with equal variances. In order to test the difference between the population means, the test statistic is:
(Multiple Choice)
4.8/5 (32)
Filters
- Essay(0)
- Multiple Choice(0)
- Short Answer(0)
- True False(0)
- Matching(0)