Exam 10: Inference From Small Samples
Exam 1: Describing Data With Graphs94 Questions
Exam 2: Describing Data With Numerical Measures186 Questions
Exam 3: Describing Bivariate Data35 Questions
Exam 4: Probability and Probability Distributions136 Questions
Exam 5: Several Useful Discrete Distributions129 Questions
Exam 6: The Normal Probability Distribution196 Questions
Exam 7: Sampling Distributions162 Questions
Exam 8: Large-Sample Estimation173 Questions
Exam 9: Large-Sample Tests of Hypotheses210 Questions
Exam 10: Inference From Small Samples261 Questions
Exam 11: The Analysis of Variance156 Questions
Exam 12: Linear Regression and Correlation165 Questions
Exam 13: Multiple Regression Analysis178 Questions
Exam 14: Analysis of Categorical Data136 Questions
Exam 15: Nonparametric Statistics198 Questions
Select questions type
The area under a chi-squared curve with 10 degrees of freedom, which is captured between the critical values  is
is  .
.
(True/False)
4.9/5  (38)
(38)
The chi-squared critical value  denotes the number on the measurement axis such that 10% of the area under the chi-squared curve with 6 degrees of freedom lies to the right of
  .
.
(True/False)
4.8/5 (39)
If two random samples of 10 and 12 observations produced sample variances equal to 7.50 and 3.20, respectively, then the calculated value of the test statistic when testing  vs.
vs.  is equal to:
(Multiple Choice)
4.7/5 (42)
Automobile insurance appraisers examine cars that have been involved in accidental collisions to assess the cost of repairs. An insurance executive is concerned that different appraisers produce significantly different assessments. In an experiment 10 cars that have recently been involved in accidents were shown to two appraisers. Each assessed the estimated repair costs. These results are shown below. 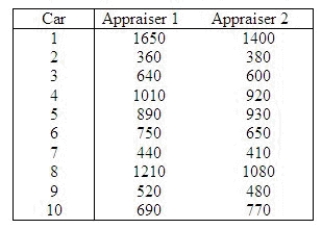 Can the executive conclude at the 5% significance level that the appraisers differ in their assessments?
Use the Data Analysis software if you prefer.
Test statistic = ______________
Critical Value(s) = ______________
Conclusion: ______________
Interpretation: __________________________________________
Can the executive conclude at the 5% significance level that the appraisers differ in their assessments?
Use the Data Analysis software if you prefer.
Test statistic = ______________
Critical Value(s) = ______________
Conclusion: ______________
Interpretation: __________________________________________
(Short Answer)
4.9/5 (35)
In a hypothesis test for the population variance, the hypotheses are  vs.
vs.  . If the sample size is 15 and the test is being carried out at the 10% level of significance, the rejection region will be:
(Multiple Choice)
5.0/5 (35)
In testing  vs.
vs.  the critical value is determined from the F-distribution table with an upper tail area equal to half the value of the level of significance.
(True/False)
4.8/5 (40)
We can design a matched pairs experiment when the data collected are:
(Multiple Choice)
4.9/5 (30)
Two samples of sizes 25 and 20 are independently drawn from two normal populations, where the unknown population variances are assumed to be equal. The number of degrees of freedom of the equal-variances t-test statistic is 44.
(True/False)
4.8/5 (46)
The manufacturer of a particular battery pack for laptop computers claims its battery pack can function for 8 hours, on the average, before having to be recharged. A random sample of 16 battery packs was selected and tested. The mean functioning time before having to be recharged was 7.2 hours with a standard deviation of 1.9 hours.
Assuming the distribution of functioning times is approximately normal, find a 95% confidence interval for the true average functioning time before needing to be recharged. Interpret the interval in part (a). Based on the interval in part (a), can the manufacturer's claim be rejected? Justify your answer.
a. What is the 95% confidence interval (CI)?
CI = ______________ Enter (n1, n2)
Interpret the interval:
________________________________________________________
The claim ______________ be rejected.
Justify your answer
(Essay)
4.9/5 (36)
We can use either the z-test or the t-test to determine whether two population variances are equal.
(True/False)
4.7/5 (39)
If you wish to test  vs.
vs.  at the .05 level of significance using a sample of 20 observations, the critical values to be used are
  32.852.
(True/False)
4.8/5 (38)
If a sample has 10 observations and a 90% confidence estimate for  is needed, the appropriate t-score is 1.833.
(True/False)
4.8/5 (29)
The public relations officer for a particular city claims the average monthly cost for childcare outside the home for a single child is $600. A potential resident is interested in whether the claim is correct. She obtains a random sample of 14 records and computes the average monthly cost of this type of childcare to be $589 with a standard deviation of $40. Perform the appropriate test of hypothesis for the potential resident using  . Approximate the p-value for the test in (a).
a. Test Statistic = ______________
b. Compute the approximate p-value associated with the test statistic in (a).
c. What is the p-value? ______________
Conclusion: ______________
The sample data ______________ support the null hypothesis at the
. Approximate the p-value for the test in (a).
a. Test Statistic = ______________
b. Compute the approximate p-value associated with the test statistic in (a).
c. What is the p-value? ______________
Conclusion: ______________
The sample data ______________ support the null hypothesis at the
 level?
(Short Answer)
4.9/5 (37)
Student's t-distribution is a sampling distribution for a random variable, t, derived from a normally distributed population, that is (1) single-peaked above the random variable's mean, median, and mode of zero, (2) perfectly symmetrical about this central value, and (3) characterized by tails extending indefinitely in both directions from the center, approaching, but never touching, the horizontal axis.
(True/False)
5.0/5 (39)
In testing  vs.
vs.  the null hypothesis will be rejected if the ratio
  is substantially longer than 1.0.
(True/False)
4.7/5 (37)
Independent random samples from two normal populations produced the variances listed here: 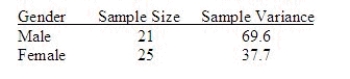 Do the data provide sufficient evidence to indicate that
  differs from
  ? Test using
  = .05.
Test Statistic = ______________
Reject Region: Reject H0 if F> ______________
Conclusion: ______________
One ______________ conclude that the variances are different.
Find the approximate p-value for the test and interpret its value.
______________ Enter (n1, n2)
Develop a 95% confidence interval for
= .05.
Test Statistic = ______________
Reject Region: Reject H0 if F> ______________
Conclusion: ______________
One ______________ conclude that the variances are different.
Find the approximate p-value for the test and interpret its value.
______________ Enter (n1, n2)
Develop a 95% confidence interval for  .
CI = ______________ Enter (n1, n2)
.
CI = ______________ Enter (n1, n2)
(Short Answer)
5.0/5 (42)
Given a random variable that has a t-distribution with the specified degrees of freedom, what percentage of the time will its value fall in the indicated region?
15 degrees of freedom, between -2.131 and 2.131
______________ (Enter as a decimal percent or use the % sign.)
19 degrees of freedom, between -2.539 and 2.539
______________ (Enter as a decimal percent or use the % sign.)
23 degrees of freedom, between -1.319 and 1.319
______________ (Enter as a decimal percent or use the % sign.)
10 degrees of freedom, between -3.169 and 3.169
______________ (Enter as a decimal percent or use the % sign.)
(Short Answer)
4.8/5 (35)
A political analyst in Michigan surveys a random sample of registered Democrats and compares the results with those obtained from a random sample of registered Republicans. This would be an example of an experimental design called a paired-difference or matched pairs design.
(True/False)
4.9/5 (36)
A random sample of 7 observations was drawn from a normal population. The following summations were computed: 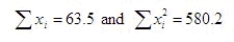 Test the hypotheses H0:
  = 8 vs. H1:
  > 8 at the 1% significance level.
Test statistic = ______________
Critical Value(s) = ______________
Conclusion: ______________
Interpretation: ______________
> 8 at the 1% significance level.
Test statistic = ______________
Critical Value(s) = ______________
Conclusion: ______________
Interpretation: ______________
(Short Answer)
4.8/5 (39)
Which of the following correctly describes degrees of freedom?
(Multiple Choice)
4.8/5 (38)
Filters
- Essay(0)
- Multiple Choice(0)
- Short Answer(0)
- True False(0)
- Matching(0)