Exam 10: Inference From Small Samples
Exam 1: Describing Data With Graphs94 Questions
Exam 2: Describing Data With Numerical Measures186 Questions
Exam 3: Describing Bivariate Data35 Questions
Exam 4: Probability and Probability Distributions136 Questions
Exam 5: Several Useful Discrete Distributions129 Questions
Exam 6: The Normal Probability Distribution196 Questions
Exam 7: Sampling Distributions162 Questions
Exam 8: Large-Sample Estimation173 Questions
Exam 9: Large-Sample Tests of Hypotheses210 Questions
Exam 10: Inference From Small Samples261 Questions
Exam 11: The Analysis of Variance156 Questions
Exam 12: Linear Regression and Correlation165 Questions
Exam 13: Multiple Regression Analysis178 Questions
Exam 14: Analysis of Categorical Data136 Questions
Exam 15: Nonparametric Statistics198 Questions
Select questions type
In comparing two population means when samples are matched pairs, the variable under consideration is d, the difference between the corresponding sample values.
(True/False)
4.8/5  (40)
(40)
Private colleges and universities rely on money contributed by individuals and corporations for their operating expenses. Much of this money is put into a fund called an endowment, and the college spends only the interest earned by the fund. A recent survey of 8 private colleges in the United States revealed the following endowments (in millions of dollars): 60.2, 47.0, 235.1, 490.0, 122.6, 177.5, 95.4, and 220.0. Summary statistics yield  =180.975 and s = 143.042. A 95% confidence interval for the mean endowment of all the private colleges in the United States is:
(Multiple Choice)
4.7/5 (28)
Let  denote the true average number of minutes of a television commercial. Suppose the hypotheses
  are tested. Assuming the commercial time is normally distributed, give the appropriate rejection region for each of the following sample sizes and significance levels.
n = 6,
are tested. Assuming the commercial time is normally distributed, give the appropriate rejection region for each of the following sample sizes and significance levels.
n = 6,  = 0.01
______________
n = 12,
= 0.01
______________
n = 12,  = 0.05
______________
n = 20,
= 0.05
______________
n = 20,  = 0.05
______________
n = 23,
= 0.05
______________
n = 23,  = 0.1
______________
You may use the Data Analysis software to find the answers.
= 0.1
______________
You may use the Data Analysis software to find the answers.
(Short Answer)
5.0/5 (34)
In testing  vs.
vs.  the following sample data were recorded: 11.5, 6.5, and 5.4. Then, the p-value of the test is:
(Multiple Choice)
4.8/5 (33)
A drapery store manager was interested in determining whether a new employee can install vertical blinds faster than an employee who has been with the company for two years.
The manager takes independent samples of 10 vertical blind installations of each of the two employees and computes the following information. 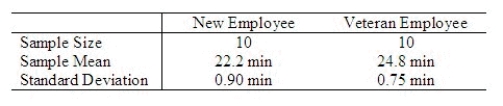 a. State the appropriate null and alternative hypotheses to test whether the new employee installs vertical blinds faster, on the average, than the veteran employee.
______________
b. Calculate the pooled estimate of the common variance.
______________
c. Calculate the value of the test statistic.
______________
d. Set up the appropriate rejection region for the hypotheses in question 41 assuming
a. State the appropriate null and alternative hypotheses to test whether the new employee installs vertical blinds faster, on the average, than the veteran employee.
______________
b. Calculate the pooled estimate of the common variance.
______________
c. Calculate the value of the test statistic.
______________
d. Set up the appropriate rejection region for the hypotheses in question 41 assuming
 = 0.05.
______________
e. What is the appropriate conclusion?
The new employee ______________ install vertical blinds faster than the veteran employee.
= 0.05.
______________
e. What is the appropriate conclusion?
The new employee ______________ install vertical blinds faster than the veteran employee.
(Short Answer)
4.7/5 (34)
Like that of the Student t-distribution, the shape of the chi-squared distribution depends on:
(Multiple Choice)
4.9/5 (34)
The 90th percentile of a chi-squared distribution with 15 degrees of freedom is equal to 22.3072.
(True/False)
4.9/5 (37)
In testing  vs.
vs.  if
if  and
and  then the calculated value of the test statistic is F = 1.60.
(True/False)
4.9/5 (40)
A statistics professor wanted to test whether the grades on statistics test were the same for upper and lower classmen. The professor took a random sample of size 12 from each and conducted a test determining that the variances were equal. For this situation, the professor should use a matched pairs t-test.
(True/False)
4.8/5 (39)
In comparing two population means of interval data, we must decide whether the samples are independent (in which case the parameter of interest is  ) or matched pairs (in which case the parameter is
  ) in order to select the correct test statistic.
(True/False)
4.9/5 (31)
If you wish to test  vs.
vs.  at the .05 level of significance using a sample of 15 observations, the critical value to be used is 23.685.
(True/False)
4.9/5 (34)
Suppose that a one-tail t-test is being applied to find out if the population mean is less than 100. The level of significance is 0.05 and 25 observations were sampled. The rejection region is:
(Multiple Choice)
4.9/5 (36)
The statistic  is chi-squared distributed with n-1 degrees of freedom only if:
(Multiple Choice)
4.9/5 (38)
The general manager of a chain of fast food chicken restaurants wants to determine how effective their promotional campaigns are. In these campaigns "20% off" coupons are widely distributed. These coupons are only valid for one week. To examine their effectiveness, the executive records the daily gross sales (in $1,000s) in one restaurant during the campaign and during the week after the campaign ends. The data is shown below. 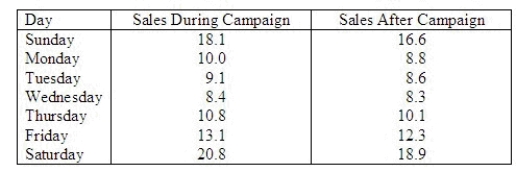 Can they infer at the 5% significance level that sales increase during the campaign?
Use the Data Analysis software if you prefer.
Test statistic = ______________
Critical Value(s) = ______________
Conclusion: ______________
Interpretation: __________________________________________
Estimate with 95% confidence the mean difference.
______________
Can they infer at the 5% significance level that sales increase during the campaign?
Use the Data Analysis software if you prefer.
Test statistic = ______________
Critical Value(s) = ______________
Conclusion: ______________
Interpretation: __________________________________________
Estimate with 95% confidence the mean difference.
______________
(Short Answer)
4.7/5 (27)
When finding a confidence interval for a population mean based on a sample of size 8, which assumption is made?
(Multiple Choice)
4.8/5 (44)
In comparing two means when samples are dependent, the variable under consideration is  , where the subscript D refers to the difference.
(True/False)
4.7/5 (43)
The pooled-variances t-test requires that the two population variances need not be the same.
(True/False)
4.9/5 (44)
The F-test used for testing the difference in two population variances is always a one-tailed test.
(True/False)
4.8/5 (37)
Filters
- Essay(0)
- Multiple Choice(0)
- Short Answer(0)
- True False(0)
- Matching(0)