Exam 10: Inference From Small Samples
Exam 1: Describing Data With Graphs94 Questions
Exam 2: Describing Data With Numerical Measures186 Questions
Exam 3: Describing Bivariate Data35 Questions
Exam 4: Probability and Probability Distributions136 Questions
Exam 5: Several Useful Discrete Distributions129 Questions
Exam 6: The Normal Probability Distribution196 Questions
Exam 7: Sampling Distributions162 Questions
Exam 8: Large-Sample Estimation173 Questions
Exam 9: Large-Sample Tests of Hypotheses210 Questions
Exam 10: Inference From Small Samples261 Questions
Exam 11: The Analysis of Variance156 Questions
Exam 12: Linear Regression and Correlation165 Questions
Exam 13: Multiple Regression Analysis178 Questions
Exam 14: Analysis of Categorical Data136 Questions
Exam 15: Nonparametric Statistics198 Questions
Select questions type
Which of the following correctly describes Student's t distribution?
(Multiple Choice)
4.8/5  (41)
(41)
For a t-distribution with 12 degrees of freedom, the area between -2.6810 and 2.1788 is 0.980.
(True/False)
4.8/5 (38)
The t-distribution allows the calculation of confidence intervals for means for small samples when the population variance is not known, regardless of the shape of the distribution in the population.
(True/False)
4.9/5 (36)
An experimenter is concerned that variability of responses using two different experimental procedures may not be the same. He randomly selects two samples of 16 and 14 responses from two normal populations and gets the statistics: s12 = 55, and s12 = 118, respectively. Do the sample variances provide enough evidence at the 10% significance level to infer that the two population variances differ?
Test statistic = ______________
Critical Value(s) = ______________
Conclusion: ______________
Interpretation: __________________________________________
Estimate with 90% confidence the ratio of the two population variances.
______________
(Short Answer)
4.8/5 (31)
In testing whether the means of two normal populations are equal, summary statistics computed for two independent samples are as follows:  ,
,  ,
,  ,
,  ,
,  , and
, and  . Assume that the population variances are equal. Then, the standard error of the sampling distribution of the sample mean difference
  is equal to:
(Multiple Choice)
4.8/5 (46)
A stylist realizes that the quicker she can give a permanent, the happier the customer will be. She has made a slight adjustment to her traditional routine in hopes of reducing the time required. A random sample of 13 permanents from before and 16 after were timed. The results of the tests are listed below. Assume the two samples were taken from normal populations with equal variances. 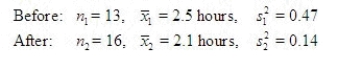 Do the sample variances present sufficient evidence to indicate that the population variance before is greater than the variance after? Test the appropriate hypotheses using a significance level of 0.05. Interpret your results.
Test Statistic = ______________
Reject Region: Reject H0 if F > ______________
Conclusion: ______________
There is ______________ to indicate that the population variance before is greater than the variance after.
Construct a 95% confidence interval (CI) for
Do the sample variances present sufficient evidence to indicate that the population variance before is greater than the variance after? Test the appropriate hypotheses using a significance level of 0.05. Interpret your results.
Test Statistic = ______________
Reject Region: Reject H0 if F > ______________
Conclusion: ______________
There is ______________ to indicate that the population variance before is greater than the variance after.
Construct a 95% confidence interval (CI) for  .
CI = ______________ Enter (n1, n2)
Find the approximate p-value for the test and interpret its value.
______________ Enter (n1, n2)
.
CI = ______________ Enter (n1, n2)
Find the approximate p-value for the test and interpret its value.
______________ Enter (n1, n2)
(Short Answer)
4.8/5 (37)
An advertisement for Meijer, a supermarket chain in Michigan, claims that Meijer has had consistently lower prices than four other full-service supermarkets. As part of a survey conducted by an "independent market basket price-checking company", the average weekly total, based on the prices of approximately 95 items, is given for two different supermarket chains recorded during 4 consecutive weeks in a particular month. 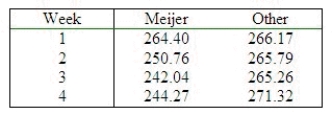 Is there a significant difference in the average prices for these two different supermarket chains? Test at
  = 0.05. What is the approximate p-value for the test? Construct a 95% confidence interval for the difference in the average prices for the two supermarket chains.
Test Statistic = ______________
Reject Region: Reject H0 if |t| > ______________
Conclusion: ______________
One ______________ conclude that the means are different.
P-value = ______________ Enter (n1, n2)
What is the 95 % confidence interval? (CI)
CI = ______________ Enter (n1, n2)
= 0.05. What is the approximate p-value for the test? Construct a 95% confidence interval for the difference in the average prices for the two supermarket chains.
Test Statistic = ______________
Reject Region: Reject H0 if |t| > ______________
Conclusion: ______________
One ______________ conclude that the means are different.
P-value = ______________ Enter (n1, n2)
What is the 95 % confidence interval? (CI)
CI = ______________ Enter (n1, n2)
(Short Answer)
4.8/5 (41)
A random sample is selected from a normally distributed population. The following sample statistics are obtained: n = 20,  = 30, and s = 10. Based on this information, and using a 95% confidence level, which of the following statements is true?
(Multiple Choice)
4.8/5 (41)
In forming a 95% confidence interval for a population mean from a sample size of 20, the number of degrees of freedom from the t-distribution equals 18.
(True/False)
4.8/5 (27)
If you wish to estimate with 95% confidence the average number of miles that students living off-campus commute to classes every day, a random sample of 20 students produced a mean equal to 5.2 miles and a standard deviation of 3.05 miles. Then, the appropriate critical value is:
(Multiple Choice)
4.9/5 (37)
Assume that the population distributions of ages (in years) of students at two different universities in Michigan are normal with equal variances. Two random samples, drawn independently from the populations, showed the following statistics.  Construct and interpret a 99% confidence interval for the true difference in average ages of students at both universities.
What is the 99% confidence interval? (CI)
CI = ______________ Enter (n1, n2)
The sample evidence supports that the two universities' students ______________ have significantly different ages.
Construct and interpret a 99% confidence interval for the true difference in average ages of students at both universities.
What is the 99% confidence interval? (CI)
CI = ______________ Enter (n1, n2)
The sample evidence supports that the two universities' students ______________ have significantly different ages.
(Short Answer)
4.8/5 (34)
Five soft drink bottling companies have agreed to implement a time management program in hopes of increasing productivity (measured in cases of soft drinks bottled per hour). The number of cases of soft drinks bottled per hour before and after the implementation of the program are listed below:
Company 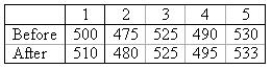 Test whether the time management has been effective in increasing productivity. Calculate the value of the test statistic Set up the appropriate rejection region for the hypotheses in part (a) assuming
  . What is the appropriate conclusion?
Use the Data Analysis software if you prefer.
Test Statistic = ______________
Reject Region: Reject H0 if |t| > ______________
Conclusion: ______________
One can conclude that the time management program ______________.
Find the approximate p-value.
______________ Enter (n1, n2)
. What is the appropriate conclusion?
Use the Data Analysis software if you prefer.
Test Statistic = ______________
Reject Region: Reject H0 if |t| > ______________
Conclusion: ______________
One can conclude that the time management program ______________.
Find the approximate p-value.
______________ Enter (n1, n2)
(Short Answer)
4.9/5 (41)
A random sample of size 15 taken from a normally distributed population revealed a sample mean of 75 and a sample variance of 25. The upper limit of a 95% confidence interval for the population mean would equal:
(Multiple Choice)
4.7/5 (34)
Which of the following is not a property of the F distribution?
(Multiple Choice)
4.8/5 (35)
If two population variances have been tested and found to be equal, then it is reasonable to conclude that the two random samples selected from the two populations have equal variances.
(True/False)
4.8/5 (44)
In testing  vs.
vs.  the larger the sample sizes from the two populations, the smaller will be the chance of committing a Type I error.
(True/False)
4.8/5 (38)
The test statistic used to test hypotheses about the population variance  is
is  , which is chi-squared distributed with n -1 degrees of freedom when the population is normally distributed with variance equal to
  .
.
(True/False)
4.8/5 (31)
The number of degrees of freedom associated with the t-test, when the data are gathered from a matched pairs experiment with 10 pairs, is:
(Multiple Choice)
4.9/5 (31)
In an effort to raise ratings, a television network president decides to reduce the number of commercials. A random sample of 8 one-hour programs was monitored from each of two major networks. The data below reflect the time in minutes of commercials for each of the 16 shows.  Suppose
  denotes the mean commercial time for network 1 and
  denotes the mean commercial time for network 2. Estimate
  using a 95% confidence interval. Assume both population distributions are normal and have equal variances.
What is the 95% confidence interval? (CI)
CI = ______________ Enter (n1, n2)
Since this interval contains zero, we are ______________ to say the two networks have significantly different commercial times.
using a 95% confidence interval. Assume both population distributions are normal and have equal variances.
What is the 95% confidence interval? (CI)
CI = ______________ Enter (n1, n2)
Since this interval contains zero, we are ______________ to say the two networks have significantly different commercial times.
(Short Answer)
4.8/5 (37)
Filters
- Essay(0)
- Multiple Choice(0)
- Short Answer(0)
- True False(0)
- Matching(0)