Exam 10: Inference From Small Samples
Exam 1: Describing Data With Graphs94 Questions
Exam 2: Describing Data With Numerical Measures186 Questions
Exam 3: Describing Bivariate Data35 Questions
Exam 4: Probability and Probability Distributions136 Questions
Exam 5: Several Useful Discrete Distributions129 Questions
Exam 6: The Normal Probability Distribution196 Questions
Exam 7: Sampling Distributions162 Questions
Exam 8: Large-Sample Estimation173 Questions
Exam 9: Large-Sample Tests of Hypotheses210 Questions
Exam 10: Inference From Small Samples261 Questions
Exam 11: The Analysis of Variance156 Questions
Exam 12: Linear Regression and Correlation165 Questions
Exam 13: Multiple Regression Analysis178 Questions
Exam 14: Analysis of Categorical Data136 Questions
Exam 15: Nonparametric Statistics198 Questions
Select questions type
A researcher believes she has designed a keyboard that is more efficient to use than a standard keyboard. In order to help decide if this is the case, typing speeds were taken for 8 different people on each keyboard. The lengths of time, in minutes, for each of the people to type a pre-selected manuscript are listed below. 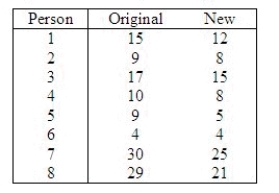 Assume the two population distributions are normal. Use the data to determine if the original keyboard yields slower times. Use a significance level of
  = 0.05.
Use the Data Analysis software if you prefer.
Test Statistic = ______________
Reject Region: Reject H0 if |t| > ______________
Conclusion: ______________
The original keyboard ______________.
= 0.05.
Use the Data Analysis software if you prefer.
Test Statistic = ______________
Reject Region: Reject H0 if |t| > ______________
Conclusion: ______________
The original keyboard ______________.
(Short Answer)
4.9/5  (40)
(40)
A customer service representative was interested in comparing the average time (in minutes) customers are placed on hold when calling Southern California Edison and Southern California Gas companies. The representative obtained two independent random samples and calculated the following summary information:  Assume the distributions of time a customer is on hold are approximately normal. Is it reasonable to assume equality of variances in this problem? Test whether there is a significant difference in average time a customer is on hold between the two companies.
Calculate the value of the test statistic. Set up the appropriate rejection region for the test in part (a) assuming
Assume the distributions of time a customer is on hold are approximately normal. Is it reasonable to assume equality of variances in this problem? Test whether there is a significant difference in average time a customer is on hold between the two companies.
Calculate the value of the test statistic. Set up the appropriate rejection region for the test in part (a) assuming  = 0.10.
What is the appropriate conclusion?
Test Statistic = ______________
Reject Region: Reject H0 if |t| > ______________
Conclusion: ______________
One ______________ conclude that there is a significant difference in mean time a customer is on hold between the two companies.
= 0.10.
What is the appropriate conclusion?
Test Statistic = ______________
Reject Region: Reject H0 if |t| > ______________
Conclusion: ______________
One ______________ conclude that there is a significant difference in mean time a customer is on hold between the two companies.
(Short Answer)
4.7/5 (35)
Ten functionally illiterate adults were given an experimental one-week crash course in reading. Each of the ten adults was given a reading test prior to the course and another test after the course. The results are shown below. 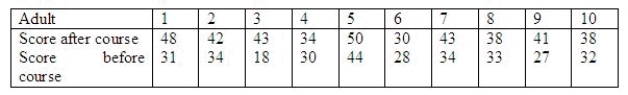 Is there enough evidence to infer at the 5% significance level that the reading scores have improved?
Use the Data Analysis software if you prefer.
Test statistic = ______________
Critical Value(s) = ______________
Conclusion: ______________
Interpretation: __________________________________________
Estimate the mean improvement with 95% confidence.
______________
Is there enough evidence to infer at the 5% significance level that the reading scores have improved?
Use the Data Analysis software if you prefer.
Test statistic = ______________
Critical Value(s) = ______________
Conclusion: ______________
Interpretation: __________________________________________
Estimate the mean improvement with 95% confidence.
______________
(Short Answer)
4.7/5 (39)
When comparing two population means using data that are gathered from a matched pairs experiment, the test statistic for  is Student t distributed with
  degrees of freedom, provided that the differences are normally distributed.
(True/False)
4.7/5 (36)
If we are testing for the difference between the means of two independent populations with equal variances, samples of  and
and  are taken, then the number of degrees of freedom is equal to:
(Multiple Choice)
4.8/5 (29)
The paired-difference t-test for the main difference between two populations assumes:
(Multiple Choice)
4.9/5 (41)
During a water shortage, a water company randomly sampled residential water meters in order to monitor daily water consumption. On a particular day, a sample of 100 meters showed a sample mean of 250 gallons and a sample standard deviation of 50 gallons. Provide a 90% confidence interval estimate of the mean water consumption for the population.
______________
(Short Answer)
5.0/5 (35)
The area to the right of a chi-squared variable is 0.025. For 5 degrees of freedom, the critical value is 11.143.
(True/False)
4.9/5 (41)
A marketing consultant was in the process of studying the perceptions of married couples concerning their weekly food expenditures. He believed that the husband's perception would be higher than the wife's. To judge his belief, he takes a random sample of ten married couples and asks each spouse to estimate the family food expenditure (in dollars) during the previous week. The data are shown below. 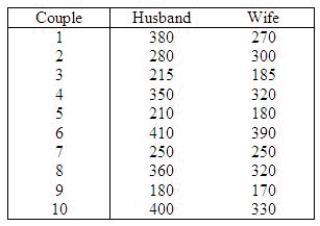 Can the consultant conclude at the 5% significance level that the husband's estimate is higher than the wife's estimate?
Use the Data Analysis software if you prefer.
Test statistic = ______________
Critical Value(s) = ______________
Conclusion: ______________
Interpretation: __________________________________________
Estimate with 95% confidence the population mean difference.
______________
Can the consultant conclude at the 5% significance level that the husband's estimate is higher than the wife's estimate?
Use the Data Analysis software if you prefer.
Test statistic = ______________
Critical Value(s) = ______________
Conclusion: ______________
Interpretation: __________________________________________
Estimate with 95% confidence the population mean difference.
______________
(Short Answer)
4.8/5 (41)
A pasta company would like to know the variability in the shelf life of their product. A random sample of 20 packages of pasta yielded a standard deviation of 5 days. Estimate the population variance using a 90% confidence interval. Assume the distribution is normal.
______________ Enter (n1, n2)
(Short Answer)
4.7/5 (30)
Two samples each of size 25 three-year-old children are taken from independent populations. The populations are distributed with equal variances. The first sample has a mean of 35.5 and a standard deviation of 3.0 while the second sample has a mean 33.0 and standard deviation of 4.0.
The pooled variance is ______________.
The computed t-statistic is ______________.
There are ______________ degrees of freedom for this test.
The critical values for a two-tailed test of the null hypothesis of no difference in the population means at the  = 0.05 level of significance ______________.
A two-tailed test of the null hypothesis of no difference would ______________ at the
= 0.05 level of significance ______________.
A two-tailed test of the null hypothesis of no difference would ______________ at the  = 0.05 level of significance.
The p-value for a two-tailed test whose computed t-statistic is 2.50 is between ______________.
If we were interested in testing against the one-tailed alternative that
= 0.05 level of significance.
The p-value for a two-tailed test whose computed t-statistic is 2.50 is between ______________.
If we were interested in testing against the one-tailed alternative that  at the
  = 0.01 level of significance, the null hypothesis would ______________.
The p-value for a one-tailed test whose computed statistic is 2.50 (in the hypothesized direction) is between ______________.
= 0.01 level of significance, the null hypothesis would ______________.
The p-value for a one-tailed test whose computed statistic is 2.50 (in the hypothesized direction) is between ______________.
(Short Answer)
4.9/5 (35)
A major department store chain is interested in estimating the average amount its credit card customers spent on their first visit to the chain's new store in the mall. Fifteen credit card accounts were randomly sampled and analyzed with the following results:  = $50.50 and
  = 400. A 95% confidence interval for the average amount the credit card customers spent on their first visit to the chain's new store in the mall is:
(Multiple Choice)
4.8/5 (33)
An experiment to determine the efficacy of using 95% ethanol or 20% bleach as a disinfectant in removing bacterial and fungal contamination when culturing plant tissues was repeated 15 times for each disinfectant. The plant tissue being cultured was sweet potato: Five cuttings per plant were placed on a petri dish for each disinfectant and stored at 25 C for 4 weeks. The observation reported was the number of uncontaminated cuttings after the 4-week storage. 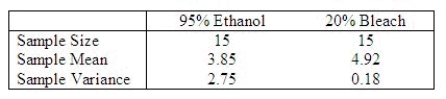 a. Is it reasonable to assume that the underlying variances are equal?
______________
b. Are you willing to conclude that there is a significant difference in the mean numbers of uncontaminated eggplants for the two disinfectants tested?
t = ______________
There ______________ evidence of a difference in the mean number of uncontaminated eggplants for the two disinfectants.
a. Is it reasonable to assume that the underlying variances are equal?
______________
b. Are you willing to conclude that there is a significant difference in the mean numbers of uncontaminated eggplants for the two disinfectants tested?
t = ______________
There ______________ evidence of a difference in the mean number of uncontaminated eggplants for the two disinfectants.
(Short Answer)
4.8/5 (29)
In testing the difference between two population means, which of the following assumptions is not true for the two-sample procedure that uses a pooled estimate of the common variance  ?
?
(Multiple Choice)
4.9/5 (43)
Here are the red blood cell counts (in 106 cells per microliter) of a healthy person measured on each of 15 days:  Find a 95% confidence interval estimate of the true mean red blood cell count for this person during the period of testing.
What is 95% confidence interval? (CI)
CI = ______________ Enter (n1, n2)
Find a 95% confidence interval estimate of the true mean red blood cell count for this person during the period of testing.
What is 95% confidence interval? (CI)
CI = ______________ Enter (n1, n2)
(Short Answer)
4.8/5 (33)
A computer laboratory manager was in charge of purchasing new battery packs for her lab of laptop computers. She narrowed her choices to two models that were available for her machines. Since the models cost about the same, she was interested in determining whether there was a difference in the average time the battery packs would function before needing to be recharged. She took two independent samples and computed the following summary information: 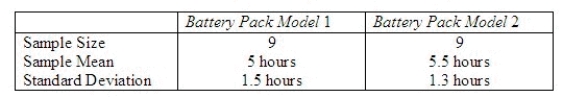 Is it reasonable to assume equality of variances in this problem? Justify your answer. Perform the appropriate test of hypothesis to determine whether there is a significant difference in average functioning time before recharging between the two models of battery packs. Test using
  = 0.05.
Test Statistic = ______________
Conclusion: ______________
One ______________ conclude that there is a significant difference in the average functioning time before recharging between the two models of battery packs.
= 0.05.
Test Statistic = ______________
Conclusion: ______________
One ______________ conclude that there is a significant difference in the average functioning time before recharging between the two models of battery packs.
(Short Answer)
4.9/5 (35)
The average low temperature for Champlin, MN in November is 12 degrees F. The average low temperature for each of 8 randomly selected years is listed below.
11.0, 12.4, 11.8, 10.9, 11.4, 12.2, 10.8, 12.2
a. Assume the November low temperature distribution is normal. It is of interest to know if the sample data suggest the average low temperature is lower than 12 degrees F.
b. Compute the test statistic for the hypotheses in (a).
Test Statistic = ______________
c. Compute the approximate p-value associated with the test statistic in (b).
What is the p-value?
______________
Conclusion: ______________
The sample data ______________ support the null hypothesis at the
 level?
(Short Answer)
5.0/5 (42)
A food processor wants to compare two preservatives for their effects on retarding spoilage. Suppose 16 cuts of fresh meat are treated with preservative A and 16 are treated with preservative B, and the number of hours until spoilage begins is recorded for each of the 32 cuts of meat. The results are summarized in the table below: 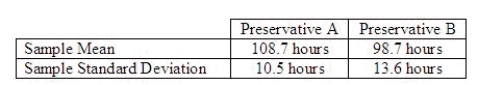 Calculate the value of the test statistic for testing the equality of the population variances, and write the proper conclusion for
  = 0.05.
Test statistic = ______________
Critical Value(s) = ______________
Conclusion: ______________
Interpretation: __________________________________________
Develop the 95% confidence interval estimate of the ratio of the two population variances.
______________
= 0.05.
Test statistic = ______________
Critical Value(s) = ______________
Conclusion: ______________
Interpretation: __________________________________________
Develop the 95% confidence interval estimate of the ratio of the two population variances.
______________
(Short Answer)
4.8/5 (43)
A 90% confidence interval estimate for the population mean constructed with a small sample will have a margin of error that is approximately  90% of the population size n.
(True/False)
4.9/5 (39)
Filters
- Essay(0)
- Multiple Choice(0)
- Short Answer(0)
- True False(0)
- Matching(0)