Exam 10: Inference From Small Samples
Exam 1: Describing Data With Graphs94 Questions
Exam 2: Describing Data With Numerical Measures186 Questions
Exam 3: Describing Bivariate Data35 Questions
Exam 4: Probability and Probability Distributions136 Questions
Exam 5: Several Useful Discrete Distributions129 Questions
Exam 6: The Normal Probability Distribution196 Questions
Exam 7: Sampling Distributions162 Questions
Exam 8: Large-Sample Estimation173 Questions
Exam 9: Large-Sample Tests of Hypotheses210 Questions
Exam 10: Inference From Small Samples261 Questions
Exam 11: The Analysis of Variance156 Questions
Exam 12: Linear Regression and Correlation165 Questions
Exam 13: Multiple Regression Analysis178 Questions
Exam 14: Analysis of Categorical Data136 Questions
Exam 15: Nonparametric Statistics198 Questions
Select questions type
Regardless of the degrees of freedom, every t-distribution is symmetric around zero.
(True/False)
4.9/5  (30)
(30)
A random sample of size 25 taken from a normally distributed population resulted in a sample standard deviation of a 0.93054. The lower and upper limits of a 99% confidence interval for the population variance would be:
(Multiple Choice)
4.9/5 (39)
Statisticians have shown that for given sample sizes  and
and  , the number of degrees of freedom associated with the equal-variances test statistic and confidence interval estimator of
  is always greater than or equal to number of degrees of freedom associated with the unequal-variances test statistic and confidence interval estimator.
(True/False)
4.9/5 (47)
Two different brands of contact lenses are to be compared for length, in hours, of comfortable wear. The lenses are available in any prescription.
How might an experiment resulting in paired data be carried out?
________________________________________________________
How might an independent samples experiment be carried out?
________________________________________________________
Which method would you recommend, and why?
________________________________________________________
(Essay)
4.9/5 (37)
Researchers determined that 60 Kleenex tissues is the average number of tissues used during a cold. Suppose a random sample of 100 Kleenex users yielded the following data on the number of tissues used during a cold:  = 52 and s = 22. Suppose the test statistic does fall in the rejection region at
  = 0.05. Which of the following conclusions is correct?
(Multiple Choice)
4.8/5 (34)
If a sample of size 20 is randomly selected from a population, the value of A for the probability P(-A  t
t  A) = 0.95 is 2.093.
(True/False)
4.8/5 (30)
Thirty-five employees who completed two years of college were asked to take a basic mathematics test. The mean and standard deviation of their scores were 75.1 and 12.8, respectively. In a random sample of 50 employees who only completed high school, the mean and standard deviation of the test scores were 72.1 and 14.6, respectively. Can we infer at the 10% significance level that a difference exists between the two groups?
Test statistic = ______________
Critical Value(s) = ______________
Conclusion: ______________
Interpretation: __________________________________________
Estimate with 90% confidence the difference in mean scores between the two groups of employees.
______________
(Short Answer)
4.8/5 (41)
If some natural relationship exists between each pair of observations that provides a logical reason to compare the first observation of sample 1 with the first observation of sample 2, the second observation of sample 1 with the second observation of sample 2, and so on, the samples are referred to as:
(Multiple Choice)
4.9/5 (34)
When testing  vs.
vs.  two random samples of sizes 10 and 8, respectively, are used. The calculated value of the test statistic is found to be equal to 2.22. Which of the following statements is true?
(Multiple Choice)
5.0/5 (38)
Butch's Dog Kennel boards and trains dogs. There are different breeds and numbers of dogs at the kennel each month. Butch would like to know the variability in the pounds of dog food used each month. A random sample of 12 months yielded the pounds of dog food listed below.
1500, 2300, 2090, 3000, 1980, 1760,
1660, 2470, 3500, 2870, 1300, 1810
Use the data to estimate the population variance using a 99% confidence interval. Assume the distribution is normal.
Use the Data Analysis software if you prefer.
______________ Enter (n1, n2), no commas in numerals
(Short Answer)
4.9/5 (34)
The value of F with area 0.05 to its right for  = 6 and
  = 9 is 3.37.
(True/False)
4.8/5 (45)
A psychologist is trying to determine how many hours the average person sleeps each night. He takes a random sample of 25 individuals and asks each person how many hours he or she slept the previous night. The sum of the observations and the sum of the squared observations are: 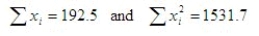 Estimate with 99% confidence the mean number of hours of sleep.
______________
Estimate with 99% confidence the mean number of hours of sleep.
______________
(Short Answer)
4.9/5 (41)
A researcher is curious about the effect of sleep on students' test performances. He chooses 50 students and gives each two tests: one given after four hours of sleep and one after eight hours of sleep. The test the researcher should use would be matched pairs t-test.
(True/False)
4.9/5 (27)
In testing the difference between two population means using two independent samples, the sampling distribution of the sample mean difference  is normal if:
(Multiple Choice)
4.9/5 (34)
A two-tailed test for two population variances could have the null hypothesis to be written as  .
.
(True/False)
4.8/5 (40)
Do government employees take longer coffee breaks than private sector workers? That is a question that interested a management consultant. To examine the issue, he took a random sample of ten government employees and another random sample of six private sector workers and measured the amount of time (in minutes) they spent in coffee breaks during the day. The results are listed below. 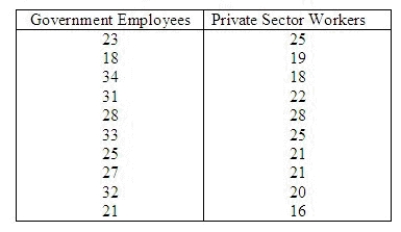 Do these data provide sufficient evidence at the 5% significance level to support the consultant's claim?
Test statistic = ______________
Critical Value(s) = ______________
Conclusion: ______________
Interpretation: ____________________________________________________
Estimate with 95% confidence the difference in coffee breaks mean time between the two groups.
______________
Do these data provide sufficient evidence at the 5% significance level to support the consultant's claim?
Test statistic = ______________
Critical Value(s) = ______________
Conclusion: ______________
Interpretation: ____________________________________________________
Estimate with 95% confidence the difference in coffee breaks mean time between the two groups.
______________
(Short Answer)
4.9/5 (32)
Which of the following statements is false for an F-distribution?
(Multiple Choice)
4.8/5 (26)
The number of degrees of freedom associated with the t-test, when the data are gathered from a matched pairs experiment with 10 pairs, is:
(Multiple Choice)
4.8/5 (39)
Filters
- Essay(0)
- Multiple Choice(0)
- Short Answer(0)
- True False(0)
- Matching(0)