Exam 21: Powerpoint Lesson 3: Working With Visual Elements
Exam 1: Access Lesson 1: Microsoft Access Basics46 Questions
Exam 2: Access Lesson 2: Creating a Database46 Questions
Exam 3: Access Lesson 3: Creating Queries46 Questions
Exam 4: Access Lesson 4: Creating and Modifying Forms46 Questions
Exam 5: Access Lesson 5: Creating and Modifying Reports46 Questions
Exam 6: Access Lesson 6: Integrating Access46 Questions
Exam 7: Excel Lesson 1: Microsoft Excel Basics46 Questions
Exam 8: Excel Lesson 2: Changing the Appearance of a Worksheet46 Questions
Exam 9: Excel Lesson 3: Organizing the Worksheet46 Questions
Exam 10: Excel Lesson 4: Entering Worksheet Formulas46 Questions
Exam 11: Excel Lesson 5: Using Functions46 Questions
Exam 12: Excel Lesson 6: Enhancing a Worksheet46 Questions
Exam 13: Excel Lesson 7: Working With Multiple Worksheets and Workbooks46 Questions
Exam 14: Excel Lesson 8: Working With Charts46 Questions
Exam 15: Microsoft Office 2010 Basics and the Internet92 Questions
Exam 16: Outlook Lesson 1: Outlook Basics and E-Mail46 Questions
Exam 17: Outlook Lesson 2: Calendar46 Questions
Exam 18: Outlook Lesson 3: Working With Other Outlook Tools46 Questions
Exam 19: Powerpoint Lesson 1: Microsoft Powerpoint Basics46 Questions
Exam 20: Powerpoint Lesson 2: Creating Enhancing Powerpoint Presentations46 Questions
Exam 21: Powerpoint Lesson 3: Working With Visual Elements46 Questions
Exam 22: Powerpoint Lesson 4: Expanding on Powerpoint Basics46 Questions
Exam 23: Publisher Lesson 1: Microsoft Publisher Basics46 Questions
Exam 24: Publisher Lesson 2: Enhancing Publisher Documents46 Questions
Exam 25: Introduction Lesson 1: Microsoft Windows 7 Basics46 Questions
Exam 26: Word Lesson 1: Microsoft Word Basics46 Questions
Exam 27: Word Lesson 2: Basic Editing46 Questions
Exam 28: Word Lesson 3: Helpful Word Features46 Questions
Exam 29: Word Lesson 4: Formatting Text46 Questions
Exam 30: Word Lesson 5: Formatting Paragraphs and Documents46 Questions
Exam 31: Word Lesson 6: Working With Graphics46 Questions
Exam 32: Word Lesson 7: Working With Documents46 Questions
Exam 33: Word Lesson 8: Increasing Efficiency Using Word46 Questions
Select questions type
To add an organization chart to a slide, you can apply a Content layout to a slide and then click the SmartArt Graphic ____ in the content placeholder.
(Multiple Choice)
4.8/5  (32)
(32)
PowerPoint includes over 80 basic styles of SmartArt graphics that are organized into seven categories that do NOT include ____.
(Multiple Choice)
4.8/5 (41)
To modify a table's borders, fill, or text boxes, select the table to open the ____ tab on the Ribbon
(Multiple Choice)
5.0/5 (39)
You can apply a table style to format the table elements at once.
(True/False)
4.9/5 (29)
The main difference between linking and embedding is where you store the data and how you update the data after you place it in the destination file.
(True/False)
4.8/5 (35)
____________________, also called graphs, provide a visual way to display numerical data in a presentation.
(Short Answer)
4.8/5 (33)
To use a tool, click and hold the mouse button, and then drag to draw. To create a perfect circle or square, hold down the Tab key as you drag.
(True/False)
4.9/5 (35)
The rotate commands on the Arrange menu do NOT include ____.
(Multiple Choice)
4.8/5 (25)
SmartArt graphics, dynamic and exciting graphics, are available for you to use on your slides in PowerPoint.
(True/False)
4.9/5 (34)
Identify the letter of the choice that best matches the phrase or definition.
Correct Answer: Verified
Premises:
Responses:
(Matching)
4.9/5 (32)
Tables are useful when you need to organize information that can be displayed in ____________________ and columns.
(Short Answer)
4.9/5 (41)
A ____________________ is a worksheet that appears with the chart and has the numbers for the chart.
(Short Answer)
4.8/5 (35)
Work with the SmartArt Tools tab on the Ribbon to change ____.
(Multiple Choice)
4.8/5 (43)
FIGURE PPT 3-1 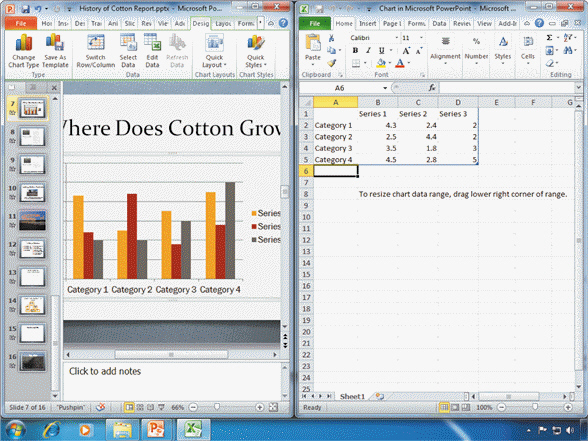 Referring to Figure PPT 3-1 above, the datasheet on the right-hand side of the window has data in it already. How could one change the data?
(Multiple Choice)
4.8/5 (30)
Case PPT 3-1 Sheila is creating a Grand Opening sign for her new pet shop Paws and Claws. Sheila inserted a shape of a star and has decided that she wants to rotate it slightly to the left. She would select the shape and then use the rotate handle indicated by the ____.
(Multiple Choice)
4.8/5 (36)
Case PPT 3-2 Derek is designing a new logo for his motorbike company to add to all of the PowerPoint slides. He is working with shapes. Derek wants to draw a sideways triangle in front of the bike to make it look like the bike is about to hit a ramp. How does he add the triangle?
(Multiple Choice)
4.8/5 (26)
A linked object, such as an Excel chart, is created in a ____ and inserted into a destination file, such as a PowerPoint slide, while maintaining a connection between the two files.
(Multiple Choice)
4.9/5 (21)
Filters
- Essay(0)
- Multiple Choice(0)
- Short Answer(0)
- True False(0)
- Matching(0)