Exam 18: Excel 2007 Unit D: Working With Charts
Exam 1: Word 2007 Unit A: Creating Documents With Word 200761 Questions
Exam 2: Word 2007 Unit B: Editing Documents61 Questions
Exam 3: Word 2007 Unit C: Formatting Text and Paragraphs64 Questions
Exam 4: Word 2007 Unit D: Formatting Documents60 Questions
Exam 5: Outlook 2007 Unit A: Getting Started With E-Mail65 Questions
Exam 6: Outlook 2007 Unit B: Managing Information Using Outlook63 Questions
Exam 7: Powerpoint 2007 Unit A: Creating a Presentation in Powerpoint 200761 Questions
Exam 8: Powerpoint 2007 Unit B: Modifying a Presentation66 Questions
Exam 9: Powerpoint 2007 Unit C: Inserting Objects Into a Presentation65 Questions
Exam 10: Powerpoint 2007 Unit D: Finishing a Presentation65 Questions
Exam 11: Access 2007 Unit A: Getting Started With Access 200763 Questions
Exam 12: Access 2007 Unit B: Building and Using Queries62 Questions
Exam 13: Access 2007 Unit C: Using Forms63 Questions
Exam 14: Access 2007 Unit D: Using Reports64 Questions
Exam 15: Excel 2007 Unit A: Getting Started With Excel 200766 Questions
Exam 16: Excel 2007 Unit B: Working With Formulas and Functions66 Questions
Exam 17: Excel 2007 Unit C: Formatting a Worksheet66 Questions
Exam 18: Excel 2007 Unit D: Working With Charts66 Questions
Exam 19: Concepts Unit A: Understanding Essential Computer Concepts66 Questions
Exam 20: Office 2007 Unit A: Getting Started With Microsoft Office 200766 Questions
Exam 21: Windows Vista Unit A: Getting Started With Windows Vista66 Questions
Exam 22: Windows Vista Unit B: Understanding File Management66 Questions
Exam 23: Windows Xp Unit A: Getting Started With Windows Xp100 Questions
Exam 24: Windows Xp Unit B: Understanding File Management101 Questions
Exam 25: Integration Unit A: Integrating Word and Excel66 Questions
Exam 26: Integration Unit B: Integrating Word, Excel, and Access66 Questions
Exam 27: Integration Unit C: Integrating Word, Excel, Access, and Powerpoint66 Questions
Exam 28: Internet Unit A: Getting Started With Internet Explorer 766 Questions
Select questions type
To show how individual volume changes over time in relation to total volume, use a(n) ____.
(Multiple Choice)
4.8/5  (41)
(41)
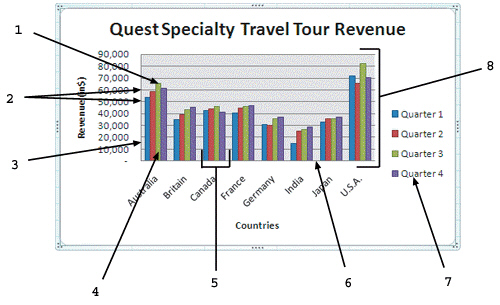 As shown in the figure above, item 8 represents the ____________________.
(Short Answer)
4.8/5 (34)
Describe some of the changes that the Chart Tools Layout tab allows you to make to a chart.
(Essay)
4.9/5 (30)
When the landscape orientation is selected, the data and chart will be positioned vertically on a page.
(True/False)
4.9/5 (39)
You can add data labels by selecting your chart, and clicking the Data Labels button in the Labels group in the Chart Tools ____ tab on the Ribbon.
(Multiple Choice)
4.9/5 (34)
When the mouse pointer hovers over any chart object, the name of the selected object appears on screen as a(n) ____________________.
(Short Answer)
5.0/5 (38)
You can apply a chart type to an existing data series in a chart to create a(n) ____ chart.
(Multiple Choice)
4.9/5 (30)
A chart sheet is a sheet in a workbook that contains only a chart, which is linked to the workbook data.
(True/False)
4.8/5 (26)
You are having trouble keeping track of your personal spending and you decide to create a worksheet and a chart to help you better understand and plan for your personal expenses. The worksheet and chart are shown below. 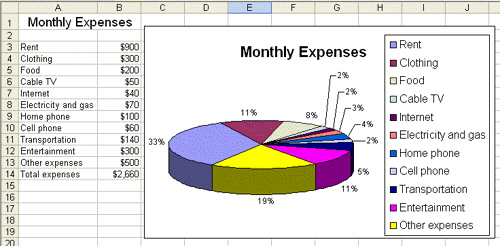 You want to explode the slide for Clothing . Write the procedure for doing this.
(Essay)
4.8/5 (49)
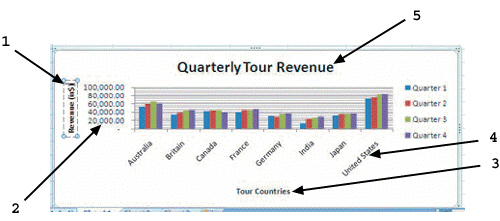 As shown in the figure above, item 5 points to the ____________________.
(Short Answer)
5.0/5 (42)
A chart that is inserted directly in the current worksheet is called a(n) ____ chart.
(Multiple Choice)
4.7/5 (37)
Filters
- Essay(0)
- Multiple Choice(0)
- Short Answer(0)
- True False(0)
- Matching(0)