Exam 18: Excel 2007 Unit D: Working With Charts
Exam 1: Word 2007 Unit A: Creating Documents With Word 200761 Questions
Exam 2: Word 2007 Unit B: Editing Documents61 Questions
Exam 3: Word 2007 Unit C: Formatting Text and Paragraphs64 Questions
Exam 4: Word 2007 Unit D: Formatting Documents60 Questions
Exam 5: Outlook 2007 Unit A: Getting Started With E-Mail65 Questions
Exam 6: Outlook 2007 Unit B: Managing Information Using Outlook63 Questions
Exam 7: Powerpoint 2007 Unit A: Creating a Presentation in Powerpoint 200761 Questions
Exam 8: Powerpoint 2007 Unit B: Modifying a Presentation66 Questions
Exam 9: Powerpoint 2007 Unit C: Inserting Objects Into a Presentation65 Questions
Exam 10: Powerpoint 2007 Unit D: Finishing a Presentation65 Questions
Exam 11: Access 2007 Unit A: Getting Started With Access 200763 Questions
Exam 12: Access 2007 Unit B: Building and Using Queries62 Questions
Exam 13: Access 2007 Unit C: Using Forms63 Questions
Exam 14: Access 2007 Unit D: Using Reports64 Questions
Exam 15: Excel 2007 Unit A: Getting Started With Excel 200766 Questions
Exam 16: Excel 2007 Unit B: Working With Formulas and Functions66 Questions
Exam 17: Excel 2007 Unit C: Formatting a Worksheet66 Questions
Exam 18: Excel 2007 Unit D: Working With Charts66 Questions
Exam 19: Concepts Unit A: Understanding Essential Computer Concepts66 Questions
Exam 20: Office 2007 Unit A: Getting Started With Microsoft Office 200766 Questions
Exam 21: Windows Vista Unit A: Getting Started With Windows Vista66 Questions
Exam 22: Windows Vista Unit B: Understanding File Management66 Questions
Exam 23: Windows Xp Unit A: Getting Started With Windows Xp100 Questions
Exam 24: Windows Xp Unit B: Understanding File Management101 Questions
Exam 25: Integration Unit A: Integrating Word and Excel66 Questions
Exam 26: Integration Unit B: Integrating Word, Excel, and Access66 Questions
Exam 27: Integration Unit C: Integrating Word, Excel, Access, and Powerpoint66 Questions
Exam 28: Internet Unit A: Getting Started With Internet Explorer 766 Questions
Select questions type
A collection of related data points is called a ____.
Free
(Multiple Choice)
4.8/5  (34)
(34)
Correct Answer: Verified
D
On a chart created in Excel, the horizontal axis is called the ____.
Free
(Multiple Choice)
4.7/5 (32)
Correct Answer:Verified
A
 As shown in the figure above, item 2 points to ____________________.
Free
(Short Answer)
4.9/5 (25)
Correct Answer:Verified
tick marks,tick mark
WordArt, which lets you create curved or stylized text, can be created using the Chart Tools Format tab.
(True/False)
4.7/5 (31)
You are a manager in the Sales department for a clothing store that has three locations. You have prepared the following worksheet containing data about the sales figures for the company, which also has a chart of the data. 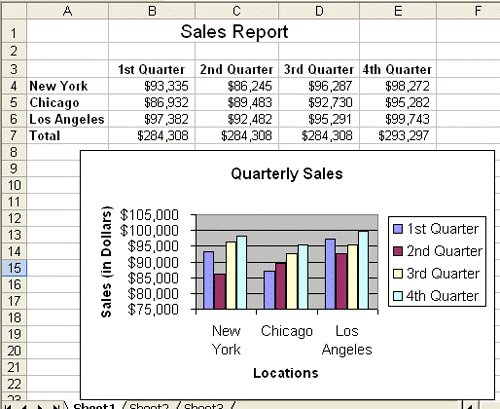 Which store location had the highest sales in the 2nd Quarter? Which had the lowest sales in the same quarter?
(Essay)
4.7/5 (33)
You can modify the data range and configuration of a chart in the ____ group of the Chart Tools Design tab.
(Multiple Choice)
4.7/5 (25)
A chart must be located in a specific cell or at a specific range address.
(True/False)
4.7/5 (28)
Any data changed in the worksheet is automatically updated in the chart.
(True/False)
4.8/5 (34)
On a chart created in Excel, the vertical axis is called the ____.
(Multiple Choice)
4.9/5 (39)
 As shown in the figure above, item ____ represents the horizontal axis.
(Multiple Choice)
4.9/5 (39)
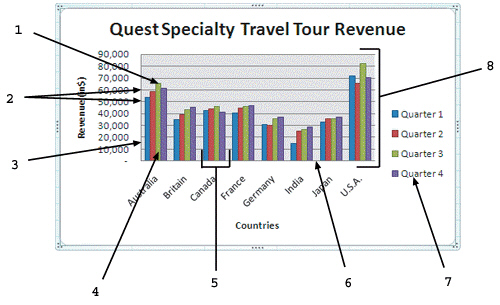 As shown in the figure above, item ____ represents a data point.
(Multiple Choice)
4.9/5 (27)
You can use buttons on the Insert tab of the Ribbon to create and modify a chart.
(True/False)
4.8/5 (23)
The z-axis of 3-D charts is used for comparing data across both categories and values.
(True/False)
4.9/5 (33)
You are having trouble keeping track of your personal spending and you decide to create a worksheet and a chart to help you better understand and plan for your personal expenses. The worksheet and chart are shown below. 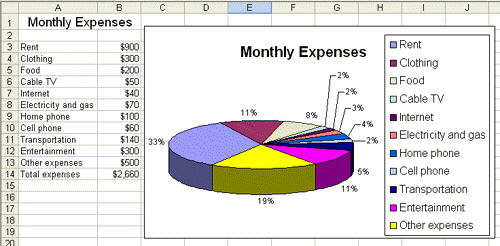 You want to explain Other Expenses a little more in the chart by using a text annotation. Write the procedure for adding a text box with the text Ex - gym fees, health insurance to the chart.
(Essay)
4.7/5 (30)
 As shown in the figure above, item ____ represents the vertical axis.
(Multiple Choice)
4.9/5 (27)
Filters
- Essay(0)
- Multiple Choice(0)
- Short Answer(0)
- True False(0)
- Matching(0)