Exam 8: Regression Wisdom
Exam 1: Data30 Questions
Exam 2: Displaying and Describing Categorical Data65 Questions
Exam 3: Displaying and Summarizing Quantitative Data93 Questions
Exam 4: Understanding and Comparing Distributions102 Questions
Exam 5: The Standard Deviation As a Ruler and the Normal Model131 Questions
Exam 6: Scatterplots, association, and Correlation74 Questions
Exam 7: Linear Regression57 Questions
Exam 8: Regression Wisdom32 Questions
Exam 9: Re-Expressing Data: Get It Straight51 Questions
Exam 10: Understanding Randomness26 Questions
Exam 11: Sample Surveys50 Questions
Exam 12: Experiments and Observational Surveys87 Questions
Exam 13: From Randomness to Probability64 Questions
Exam 14: Probability Rules90 Questions
Exam 15: Random Variables112 Questions
Exam 16: Probability Models114 Questions
Exam 17: Sampling Distribution Models45 Questions
Exam 18: Confidence Intervals for Proportions56 Questions
Exam 19: Testing Hypotheses About Proportions50 Questions
Exam 20: More About Tests69 Questions
Exam 21: Comparing Two Proportions52 Questions
Exam 22: Inferences About Means106 Questions
Exam 23: Comparing Means43 Questions
Exam 24: Paired Samples and Blocks33 Questions
Exam 25: Comparing Counts78 Questions
Exam 26: Inferences for Regression51 Questions
Exam 27: Analysis of Variance39 Questions
Exam 28: Multifactor Analysis of Variance22 Questions
Exam 29: Multiple Regression22 Questions
Exam 30: Multiple Regression Wisdom21 Questions
Exam 31: Rank-Based Nonparametric Tests29 Questions
Exam 32: The Bootstrap31 Questions
Select questions type
The table below displays the latitude (degrees north)and average daily minimum temperature in January (in degrees Fahrenheit)for some cities located in the northern hemisphere. 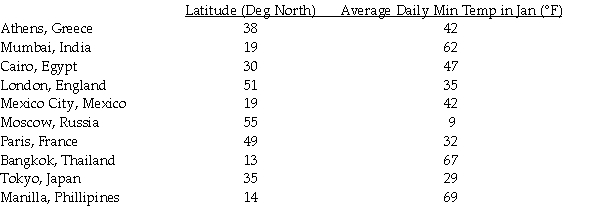 The scatter plot and regression equation are shown below:
 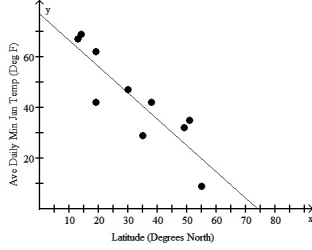 The regression analysis of this data yields the following values:
 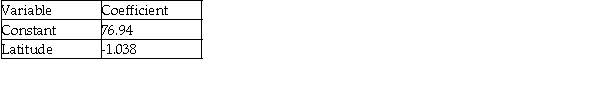 R2 = 0.7660
Use this model to predict the average daily minimum temperature in January for Panama City whose latitude is 9 degrees north.
R2 = 0.7660
Use this model to predict the average daily minimum temperature in January for Panama City whose latitude is 9 degrees north.
(Multiple Choice)
4.8/5  (30)
(30)
The figure below shows the life expectancy for persons living in the U.S.A. 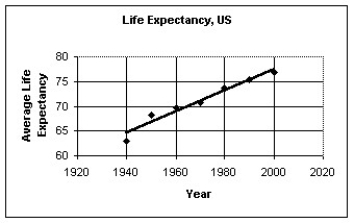 The regression analysis of the data yields the following values:
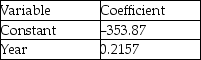 R2 = 0.9539
Use the regression model to predict the life expectancy in 2015.
R2 = 0.9539
Use the regression model to predict the life expectancy in 2015.
(Multiple Choice)
4.8/5 (32)
,The total home-game attendance for major-league baseball is the sum of all attendees for all stadiums during the entire season.The home attendance (in millions)for a number of years is shown in the table below.
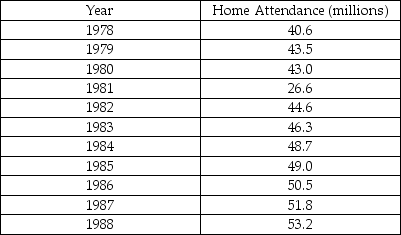 a)Make a scatterplot showing the trend in home attendance.Describe what you see.
 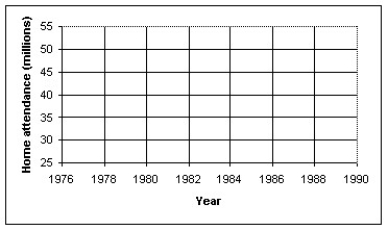 b)Determine the correlation,and comment on its significance.
c)Find the equation of the line of regression.Interpret the slope of the equation.
d)Use your model to predict the home attendance for 1998.How much confidence do you have in this prediction? Explain.
e)Use the internet or other resource to find reasons for any outliers you observe in the scatterplot.
b)Determine the correlation,and comment on its significance.
c)Find the equation of the line of regression.Interpret the slope of the equation.
d)Use your model to predict the home attendance for 1998.How much confidence do you have in this prediction? Explain.
e)Use the internet or other resource to find reasons for any outliers you observe in the scatterplot.
(Essay)
4.9/5 (40)
Which of the labeled points below will exert the largest leverage on a linear model of the data? 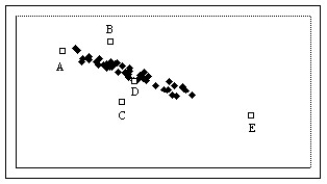
(Multiple Choice)
4.7/5 (49)
A university studied students' grades and established a strong positive association between the high school average of incoming students and their university GPA.Describe three different possible cause-and-effect relationships that might be present.
(Multiple Choice)
4.7/5 (45)
The scatterplot below displays the total home attendance (in millions)for major league baseball's National League for the years 1960 through 2002.This total home attendance is the grand total of all attendees at all National League games during the season.For what range of years is a linear model appropriate? 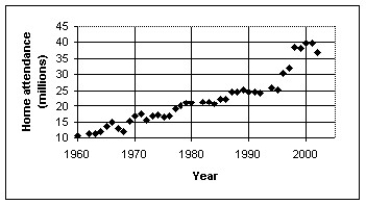
(Multiple Choice)
4.8/5 (34)
Which of the following scatterplots of residuals suggests that a linear model may not be applicable?
I 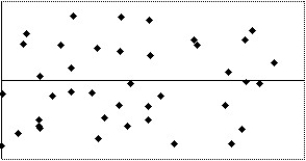 II
II 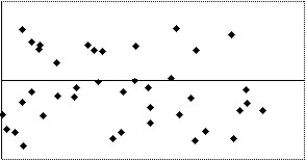 III
III 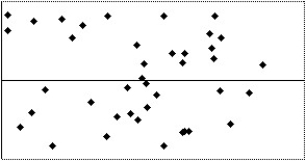 IV
IV 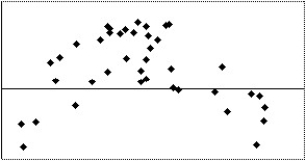
(Multiple Choice)
5.0/5 (38)
The scatterplot below displays world population (in millions)for the years 0 - 1800.Where the population is an estimate,the lower estimate is given.For what range of years is a linear model appropriate? 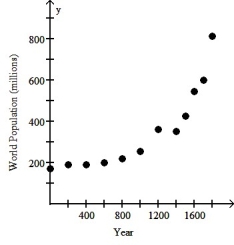
(Multiple Choice)
4.8/5 (44)
The figure below shows the recent trend in first-birth rate for women in the U.S.A.between the ages of 18 and 19.(The first-birth rate is the number of 18 to 19 year-olds per 1000 who give birth to their first child). 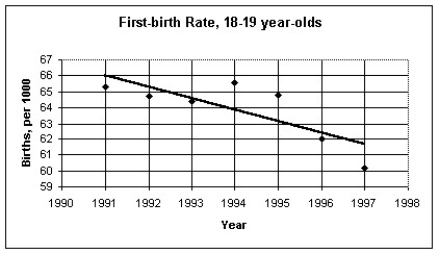 The regression analysis of this data yields the following values:
 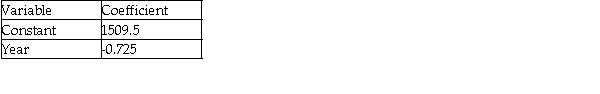 R2 = 0.6174
Use this model to predict the first-birth rate for 18 to 19 year-olds in 2006.
R2 = 0.6174
Use this model to predict the first-birth rate for 18 to 19 year-olds in 2006.
(Multiple Choice)
4.8/5 (36)
Which of the labeled points below will exert the largest leverage on a linear model of the data? 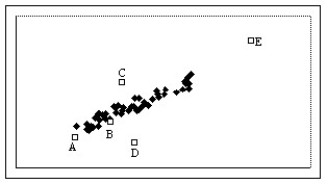
(Multiple Choice)
4.8/5 (29)
Filters
- Essay(0)
- Multiple Choice(0)
- Short Answer(0)
- True False(0)
- Matching(0)