Exam 8: Regression, Associations, and Predictive Modeling
Exam 1: Exploring and Understanding Data125 Questions
Exam 2: Exploring Relationships Between Variables165 Questions
Exam 3: Gathering Data111 Questions
Exam 4: Randomness and Probability148 Questions
Exam 5: From the Data at Hand to the World at Large128 Questions
Exam 6: Accessing Associations Between Variables93 Questions
Exam 7: Inference When Variables Are Related25 Questions
Exam 8: Regression, Associations, and Predictive Modeling792 Questions
Select questions type
The five-number summary for the fuel economy (in miles per gallon) of year 2011 midsize
cars is: Min Q1 Median Q3 Max 13 21 23 26 50
a. Would you expect the mean gas mileage of all midsize cars to be higher or lower than
the median? Explain.
b. One model of Volkswagon gets 34 mpg, one model of Toyota gets 28 mpg, and one
model of Bentley gets 13 mpg. Are any of these cars outliers (according to the original
statistics above)? Explain.
(Essay)
4.9/5  (42)
(42)
Write the equation of the least-squares regression line for the transformed data. Draw the
regression line on the scatterplot in question 2.
(Essay)
4.7/5 (42)
Insurance company records indicate that 12% of all teenage drivers have been ticketed for speeding
And 9% for going through a red light. If 4% have been ticketed for both, what is the probability that
A teenage driver has been issued a ticket for speeding but not for running a red light?
(Multiple Choice)
4.8/5 (31)
Describe to management an advantage and disadvantage of using a 1% alpha level of
significance instead.
(Essay)
4.9/5 (43)
A truck company wants on-time delivery for 98% of the parts they order from a metal Manufacturing plant. They have been ordering from Hudson Manufacturing but will switch to a New, cheaper manufacturer (Steel-R-Us) unless there is evidence that this new manufacturer Cannot meet the 98% on-time goal. As a test the truck company purchases a random sample of Metal parts from Steel-R-Us, and then determines if these parts were delivered on-time. Which Hypothesis should they test?
(Multiple Choice)
4.7/5 (36)
Which statement about residuals plots is true?
I. A curved pattern indicates nonlinear association between the variables.
II. A pattern of increasing spread indicates the predicted values become less reliable as the
Explanatory variable increases.
III. Randomness in the residuals indicates the model will predict accurately.
(Multiple Choice)
4.8/5 (37)
In this context describe a Type I error and the impact such an error would have on the
company.
(Essay)
4.8/5 (39)
Egg weights The weights of hens' eggs are normally distributed with a mean of 56 grams
and a standard deviation of 4.8 grams. What is the probability that a dozen randomly
selected eggs weighs over 690 grams?
(Essay)
4.8/5 (40)
A plot of the residuals versus the fitted values for record-breaking times of female
marathon runners for the years 1998 - 2003 is: 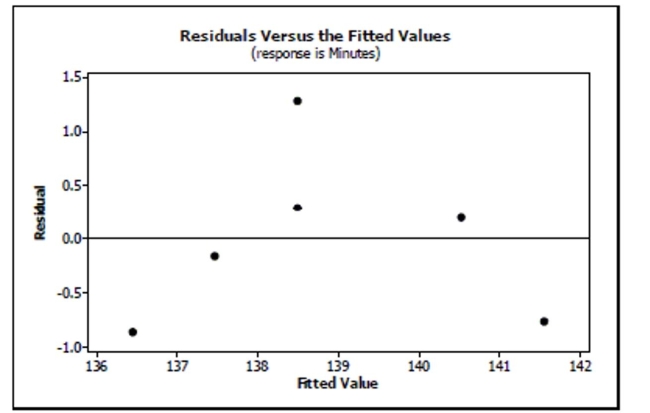 Based on this residuals plot, does it seem reasonable to use linear regression for this
model? Explain.
Based on this residuals plot, does it seem reasonable to use linear regression for this
model? Explain.
(Essay)
4.9/5 (34)
One thousand students from a local university were sampled to gather information such as
gender, high school GPA, college GPA, and total SAT scores. The results were used to
create histograms displaying high school grade point averages (GPAs) for both males and
females. Compare the grade distribution of males and females. 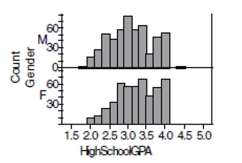
(Essay)
4.8/5 (37)
What is the probability that there is at least one gold winner among the first six customers?
(Essay)
4.9/5 (28)
A regression equation is found that predicts the increased cost of a home owner's electricity bill given the number of holiday lights they put on the outside of their house. The equation is dollars = (light). If a house has 400 lights and a increase in their electricity cost, find their residual.
(Multiple Choice)
4.8/5 (31)
If these data were collected in California, would you feel confident in using this equation to
make predictions about Florida orange groves also? Explain.
(Essay)
4.7/5 (39)
Do you think a model could accurately predict the number of calories in a serving of cereal
that has 22 grams of fiber? Explain.
(Essay)
4.7/5 (38)
Strange dice A game is played with 2 strange dice.
• The six faces of Die A show a 1 and five 3's.
• Die B has four 2's and two 6's.
a. Create a probability model for the total you get when you roll both dice.
b. Find the mean of the total.
c. Find the standard deviation of the total.
(Essay)
4.7/5 (32)
A silly psychology student gathers data on the shoe size of 30 of his classmates and their GPA's.
The correlation coefficient between these two variables is most likely to be
(Multiple Choice)
4.9/5 (42)
All students in a physical education class completed a basketball free-throw shooting
event and the highest number of shots made was 32. The next day a student who had just
transferred into the school completed the event, making 35 shots. Indicate whether adding
the new student's score to the rest of the data made each of these summary statistics
increase, decrease, or stay about the same:
a. mean
b. median
c. range
d. IQR
e. standard deviation
(Essay)
4.8/5 (43)
Filters
- Essay(0)
- Multiple Choice(0)
- Short Answer(0)
- True False(0)
- Matching(0)