Exam 8: Regression, Associations, and Predictive Modeling
Exam 1: Exploring and Understanding Data125 Questions
Exam 2: Exploring Relationships Between Variables165 Questions
Exam 3: Gathering Data111 Questions
Exam 4: Randomness and Probability148 Questions
Exam 5: From the Data at Hand to the World at Large128 Questions
Exam 6: Accessing Associations Between Variables93 Questions
Exam 7: Inference When Variables Are Related25 Questions
Exam 8: Regression, Associations, and Predictive Modeling792 Questions
Select questions type
If a 6-sided die is rolled 5 times and rolling a 2 is considered to be a success, what are the chances
of rolling exactly three successes?
A) 32.15%
B) none of these
C) 16.67%
D) 33.33%
E) 0.32%
(Essay)
4.9/5  (29)
(29)
Find a 95% confidence level for the difference in the proportions of illiteracy in men and
women from Qatar. Interpret your interval.
(Essay)
4.8/5 (40)
The advantage of making a stem-and-leaf display instead of a dotplot is that a stem-and-leaf
Display
(Multiple Choice)
4.8/5 (39)
Hoping to get information that would allow them to negotiate new rates with their advertisers,
Natural Health magazine phoned a random sample of 600 subscribers. 64% of those polled said they
Use nutritional supplements. Which is true?
I. The population of interest is the people who read this magazine.
II. "64%" is not a statistic; it's the parameter of interest.
III. This sampling design should provide the company with a reasonably accurate estimate of the
Percentage of all subscribers who use supplements.
(Multiple Choice)
4.8/5 (29)
A regression analysis of students' AP* Statistics test scores and the number of hours they spent doing homework found . Which of these is true?
I. of student test scores can be correctly predicted with this model.
II. Homework accounts for of your grade in AP* Stats.
III. There's a chance that you'll get the score this model predicts for you.
(Multiple Choice)
5.0/5 (31)
Housing costs A government report on housing costs says that single-family home prices
nationwide are skewed to the right, with a mean of $235,700. We want to see how home
prices in Orange County, California compare with those nationwide.
a. We collect price data from a random sample of 50 homes in Orange County, California.
Why is it okay to use these data for inference even though the population is skewed?
b. The standard deviation of the 50 homes in our sample was $25,500. Specify the sampling
model for the mean price of such samples.
c. This sample of randomly chosen homes produced a 90% confidence interval for the
mean price in Orange County of ($233954, $246046). Does this interval provide evidence
that single-family home prices are unusually high in this county? Explain briefly.
d. Suppose we want to collect a new sample. How many homes must we survey to have
90% confidence of estimating the mean local price to within $2000?
(Essay)
4.7/5 (51)
Public opinion A member of the City Council has proposed a resolution opposing
construction of a new state prison there. The council members decide they want to assess
public opinion before they vote on this resolution. Below are some of the methods that are
proposed to sample local residents to determine the level of public support for the
resolution. Match each with one of the listed sampling techniques.
a. Place an announcement in the newspaper asking people to call their council
representatives to register their opinions. Council members will tally the calls they receive.
b. Have each council member survey 50 friends, neighbors, or co-workers.
c. Have the Board of Elections assign each voter a number, then select 400 of them using a
random number table.
d. Go to a downtown street corner, a grocery store, and a shopping mall; interview 100
typical shoppers at each location.
e. Randomly pick 50 voters from each election district.
f. Call every 500th person in the phone book.
g. Randomly pick several city blocks, then randomly pick 10 residents from each block.
h. Randomly select several city blocks; interview all the adults living on each block. 1 cluster 2 convenience 3 judgment 4 multistage 5 simple (SRS) 6 stratified 7 systematic 8 voluntary response
(Essay)
4.7/5 (37)
Shrimp From 1982 to 1990, there was a decrease in the number of white shrimp harvested
from the Galveston Bay. Here is the regression analysis and a residual plot. The year has
been shortened to two digits (82, 83…) and the dependent variable is the number of shrimp
collected per hour. Dependent Variable: Shrimp/hour
R-sq =0.9496342 :6.0232354
Parameter Estimate Std. Err. constant 816.71111 66.903419 year -8.9333333 0.77759635
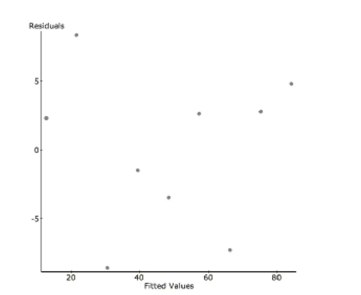 a. Write the regression equation and define your variables.
b. Find the correlation coefficient and interpret it in context.
c. Interpret the value of the slope in context.
d. In 1991, the shrimp production rebounded (in part due to the effects of El Nino) to 81
shrimp/hour. Find the value of this residual.
e. The prediction for 1991 was very inaccurate. What name do statisticians give to this kind
of prediction error?
a. Write the regression equation and define your variables.
b. Find the correlation coefficient and interpret it in context.
c. Interpret the value of the slope in context.
d. In 1991, the shrimp production rebounded (in part due to the effects of El Nino) to 81
shrimp/hour. Find the value of this residual.
e. The prediction for 1991 was very inaccurate. What name do statisticians give to this kind
of prediction error?
(Essay)
4.7/5 (32)
Here are data about the average January low temperature in cities in the United States, and factors that might allow us to
predict temperature. The data, available for 55 cities, include:
JANTEMP Mean January low temperature (degrees F.)
LAT Latitude (degrees of latitud
LONG Longitude (degrees of longitud
ALTITUDE Altitude at the airport (where the temperatures have been recorded, in feet above sea level)
COAST Approximate distance from the nearest seacoast (east or west, in degrees longitud
We will attempt to make a regression model to help account for mean January temperature and to understand the effects of the
various predictors.
At each step of the analysis you may assume that things learned earlier in the process are known.
Units Note: The "degrees" of temperature, given here on the Fahrenheit scale, have only coincidental language relationship to the
"degrees" of longitude and latitude. The geographic "degrees" are based on modeling the Earth as a sphere and dividing it up into 360
degrees for a full circle. Thus 180 degrees of longitude is halfway around the world from Greenwich, England (0°) and Latitude
increases from 0 degrees at the Equator to 90 degrees of (North) latitude at the North Pole. 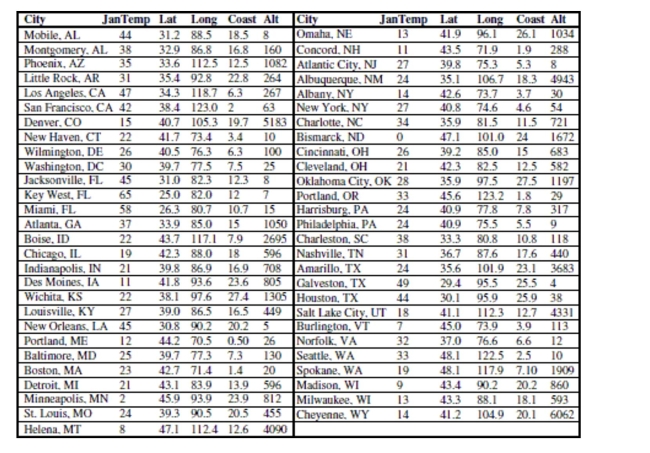 -First, we consider the relationship between temperature and latitude. This seems to be the
obvious first choice; everybody knows that northern (high latitude) cities tend to be colder
in January than southern (lower latitude) cities. Here is the scatterplot:
-First, we consider the relationship between temperature and latitude. This seems to be the
obvious first choice; everybody knows that northern (high latitude) cities tend to be colder
in January than southern (lower latitude) cities. Here is the scatterplot: 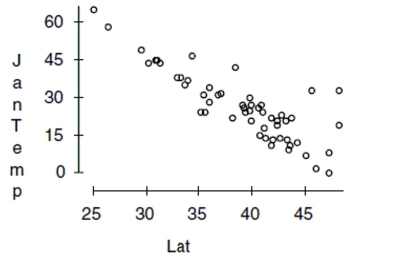 Describe what you see in this scatterplot in a sentence or two. Which of the regression
assumptions for the regression of Jantemp on Lat can you check with this plot? State them
and indicate whether you think they seem to be satisfied.
Describe what you see in this scatterplot in a sentence or two. Which of the regression
assumptions for the regression of Jantemp on Lat can you check with this plot? State them
and indicate whether you think they seem to be satisfied.
(Essay)
4.8/5 (44)
Match the following descriptions with the most likely correlation coefficient.
____ The number of hours you study and your exam score.
____ The number of siblings you have and your GPA.
____ The number of hours you practice a task and the number of minutes it takes you to
complete it.
____ The number of hours you use a pencil and its length.
A. -0.78
B. 0.13
C. 0.46
D. 0.89
(Essay)
4.8/5 (35)
The lifespans of a particular brand of graphing calculator are approximately normally
distributed with a mean of 620 days from the purchase date and a standard deviation of 82
days. They will provide a warranty that guarantees a replacement if the calculator stops
working within the specified time frame, and are trying to decide what time frame to use.
a. If the company sets the warranty at a year and a half (say 540 days), what proportion of
calculators will they have to replace?
b. The company does not want to have to replace more than 1% of the calculators they sell.
What length of time should they set for the warranty?
c. The company would like to set the warranty for 540 days, and still replace no more than
1% of the calculators sold. Increasing the average life of the calculators is too expensive, but
they think they reduce the standard deviation of the lifespans. What standard deviation of
lifespans would be needed to make this happen?
d. Explain what achieving a smaller standard deviation means in this context.
(Essay)
4.9/5 (39)
Too much TV? A father is concerned that his teenage son is watching too much television
each day, since his son watches an average of 2 hours per day. His son says that his TV
habits are no different than those of his friends. Since this father has taken a stats class, he
knows that he can actually test to see whether or not his son is watching more TV than his
peers. The father collects a random sample of television watching times from boys at his
son's high school and gets the following data:
1.9 2.3 2.2 1.9 1.6 2.6 1.4 2.0 2.0 2.2
Is the father right? That is, is there evidence that other boys average less than 2 hours of
television per day? Conduct a hypothesis test, making sure to state your conclusions in the
context of the problem.
(Essay)
4.7/5 (39)
What is the probability that the first customer to win a 30% discount is the sixth customer
that enters the store?
(Essay)
4.8/5 (40)
Using the equation in number #8 again, if a homeowner doubles the number of lights he uses from
500 to 1000, how much do we predict he will increase his electric bill by?
(Multiple Choice)
4.8/5 (37)
Property taxes Administrators of the fire department are concerned about the possibility of
implementing a new property tax to raise moneys needed to replace old equipment. They
decide to check on public opinion by having a random sample of the city's population.
a. Several plans for choosing the sample are proposed. Match each plan with the letter
corresponding to the sampling strategy.
_____i. The city has five property classifications: single family homes, apartments,
condominiums, temporary housing (hotel and campgrounds), and retail property.
Randomly select ten residents
from each category.
_____ii. Each property owner has a 5-digit ID number. Use a random number table to
choose forty numbers.
_____iii. At the start of each week, survey every tenth person who arrives at the city park.
_____iv. Randomly select 20 city blocks and survey all the residents in each block.
_____v. Have each firefighter survey 10 of his/her neighbors.
A. convenience
B. stratified
C. simple
D. cluster
E. systematic
b. Name and briefly describe the kind of bias that might be present if the administration
decides that instead of selecting people randomly they'll just…
i. interview people about the new property tax at a fire station open house.
ii. ask people who are willing to be taxed to sign a petition.
(Essay)
4.7/5 (36)
Credit card sales The National Association of Retailers reports that 62% of all purchases
are now made by credit card; you think this is true at your store as well. On a typical day
you make 20 sales.
a. Explain why your sales can be considered Bernoulli trials.
b. What is the probability that your fourth customer is the first one who uses a credit card?
c. Let X represent the number of customers who use a credit card on a typical day. What is
the probability model for X? Specify the model (name and parameters), and tell the mean
and standard deviation.
d. What is the probability that on a typical day at least half of your customers use a credit
card?
(Essay)
4.9/5 (32)
Which is true of the data shown in the histogram? 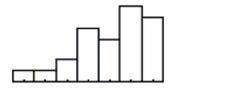 I. The distribution is skewed to the right.
II) The mean is probably smaller than the median.
III) We should use median and IQR to summarize these data.
I. The distribution is skewed to the right.
II) The mean is probably smaller than the median.
III) We should use median and IQR to summarize these data.
(Multiple Choice)
4.8/5 (43)
Filters
- Essay(0)
- Multiple Choice(0)
- Short Answer(0)
- True False(0)
- Matching(0)