Exam 8: Regression, Associations, and Predictive Modeling
Exam 1: Exploring and Understanding Data125 Questions
Exam 2: Exploring Relationships Between Variables165 Questions
Exam 3: Gathering Data111 Questions
Exam 4: Randomness and Probability148 Questions
Exam 5: From the Data at Hand to the World at Large128 Questions
Exam 6: Accessing Associations Between Variables93 Questions
Exam 7: Inference When Variables Are Related25 Questions
Exam 8: Regression, Associations, and Predictive Modeling792 Questions
Select questions type
Trainers need to estimate the level of fat in athletes to ensure good health. Initial tests were based
On a small sample but now the trainers double the sample size for a followup test. The main
Purpose of the larger sample is to…
(Multiple Choice)
4.9/5  (33)
(33)
On Monday, a class of students took a big test, and the highest score was 92. The next day,
a student who had been absent made up the test, scoring 100. Indicate whether adding that
student's score to the rest of the data made each of these summary statistics increase,
decrease, or stay about the same:
a. mean
b. median
c. range
d. IQR
e. standard deviation
(Essay)
4.7/5 (41)
Wildlife scientists studying a certain species of frogs know that past records indicate the
adults should weigh an average of 118 grams with a standard deviation of 14 grams. The
researchers collect a random sample of 50 adult frogs and weigh them. In their sample the
mean weight was only 110 grams. One of the scientists is alarmed, fearing that
environmental changes may be adversely affecting the frogs. Do you think this sample
result is unusually low? Explain.
(Essay)
4.8/5 (36)
Listed below are the names of 20 students who are juniors. Use the random numbers listed
below to select five of them to be in your sample. Clearly explain your method. Adam Chris Dave Deirdre Dick Ellen Eric Joan John Judi Joy Kenny Laura Mary Paul Peter Rachel Rob Sara Stacey
(Essay)
4.8/5 (36)
When using midterm exam scores to predict a student's final grade in a class, the student would
Prefer to have a
(Multiple Choice)
4.9/5 (45)
One your classmates is working on a science project for a unit on weather. She tracks the
temperature one day, beginning at sunrise and finishing at sunset. Given that you are
know for being the stats expert, she asks you about calculating the correlation for her data.
What is the best advice you could give her?
(Essay)
4.7/5 (34)
Describe how to use a retrospective study to determine if the home teams have an unfair
advantage when shooting free-throws.
(Essay)
4.9/5 (42)
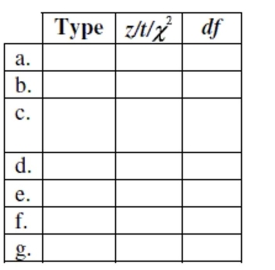
Test identification Suppose you were asked to analyze each of the situations described below. (NOTE: Do not do these problems!) For each, indicate which procedure you would use (pick the appropriate number from the list), the test statistic , or "chi-squared"), and, if or , the number of degrees of freedom. A procedure may be used more than once.
 1. proportion - 1 sample
2. difference of proportions - 2 samples
3. mean - 1 sample
4. difference of means - independent samples
5. mean of differences - matched pairs
6. goodness of fit
7. homogeneity
8. independence
a. Among randomly selected pets, 27% of the 188 dogs and 18% of the 167 cats had fleas.
Does this indicate a significant difference in rates of flea problems for these two pets?
b. Are there more broken bones in summer or winter? We get records about the number of
fractures treated in January and July at a random sample of 25 emergency rooms.
c. A random sample of 600 high school seniors reported their grade point averages and the
amount of financial aid offered them by colleges. We wonder if there is an association
between academic success and college aid.
d. For a random sample of 200 drivers at a gas station, we record the driver's gender (male
or female) and the type of gasoline purchased (regular, plus, or premium). We wonder if
there is an association between a driver's gender and the type of gasoline they buy.
e. The school newspaper wants a 95% confidence interval for the road test failure rate. In a
random sample of 65 student drivers, 37 said they failed their driver's test at least once.
f. A supermarket chain wants to know which of two merchandise display methods is more
effective. They randomly assign 15 stores to use display type A and 15 others to use display
type B, then collect data about the number of items sold at each store.
g. Tags placed on garbage cans allow the disposal of up to 30 pounds of garbage. A
random sample of 22 cans averaged 33.2 pounds with a standard deviation of 3.2 pounds.
Is this strong evidence that residents overload their garbage cans?
1. proportion - 1 sample
2. difference of proportions - 2 samples
3. mean - 1 sample
4. difference of means - independent samples
5. mean of differences - matched pairs
6. goodness of fit
7. homogeneity
8. independence
a. Among randomly selected pets, 27% of the 188 dogs and 18% of the 167 cats had fleas.
Does this indicate a significant difference in rates of flea problems for these two pets?
b. Are there more broken bones in summer or winter? We get records about the number of
fractures treated in January and July at a random sample of 25 emergency rooms.
c. A random sample of 600 high school seniors reported their grade point averages and the
amount of financial aid offered them by colleges. We wonder if there is an association
between academic success and college aid.
d. For a random sample of 200 drivers at a gas station, we record the driver's gender (male
or female) and the type of gasoline purchased (regular, plus, or premium). We wonder if
there is an association between a driver's gender and the type of gasoline they buy.
e. The school newspaper wants a 95% confidence interval for the road test failure rate. In a
random sample of 65 student drivers, 37 said they failed their driver's test at least once.
f. A supermarket chain wants to know which of two merchandise display methods is more
effective. They randomly assign 15 stores to use display type A and 15 others to use display
type B, then collect data about the number of items sold at each store.
g. Tags placed on garbage cans allow the disposal of up to 30 pounds of garbage. A
random sample of 22 cans averaged 33.2 pounds with a standard deviation of 3.2 pounds.
Is this strong evidence that residents overload their garbage cans?
(Essay)
4.8/5 (48)
Which of the following equations used in regression is incorrect?
(Multiple Choice)
4.8/5 (27)
Health insurance The World Almanac and Book of Facts 2004 reported the percent of people
not covered by health insurance in the 50 states and Washington, D.C., for the year 2002.
Computer output gives these summaries for the percent of people not covered by health
insurance: Min Q1 Median Q3 Max Mean SD 7.9 10.8 13.4 16.7 25.8 13.9 3.6
a. Were any of the states outliers? Explain how you made your decision.
b. A histogram of the data is as follows: 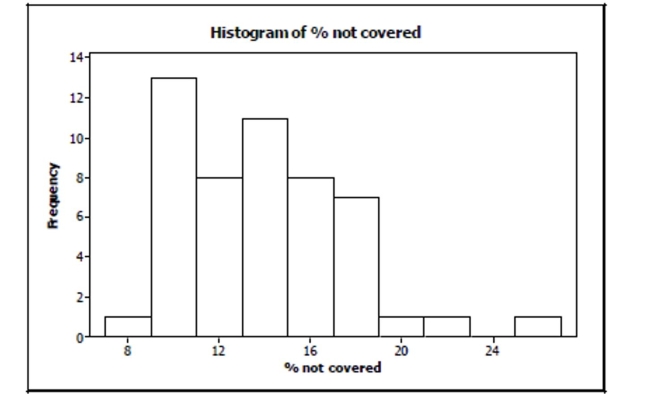 Is it more appropriate to use the mean and standard deviation or the median and IQR to
describe these data? Explain.
Is it more appropriate to use the mean and standard deviation or the median and IQR to
describe these data? Explain.
(Essay)
4.9/5 (39)
Military funding A college group is investigating student opinions about funding of the
military. They phone a random sample of students at the college, asking each person one of
these questions (randomly chosen):
A: "Do you think that funding of the military should be increased so that the United States can
better protect its citizens?"
B: "Do you think that funding of the military should be increased?"
Which question do you expect will elicit greater support for increased military funding?
Explain. What kind of bias is this?
(Essay)
4.8/5 (37)
What is the probability that the first gold winner (100%) is the fifth customer in line?
(Essay)
4.7/5 (38)
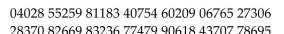
Show three trials by clearly labeling the random number table given below. Specify the
outcome for each trial. 57528 78305 63508 29418 90676 31993 54636 17877 31574 28042 72621 84818
(Essay)
4.8/5 (36)
Since r2 is not 100%, there must be other factors in influencing the number of oranges
harvested. What percentage is that and what is another factor you think might be
involved?
(Essay)
4.9/5 (33)
Education research consistently shows that students from wealthier families tend to have higher
SAT scores. The slope of the line that predicts SAT score from family income is 6.25 points per $1000,
And the correlation between the variables is 0.48. Then the slope of the line that predicts family
Income from SAT score (in $1000 per point) …
(Multiple Choice)
4.8/5 (39)
What are the mean and standard deviation of the restaurant's annual expense for the
service contract?
(Essay)
4.9/5 (30)
They actually select a random sample of 450 applications, and find that 46 of those
students attend private schools. Create the confidence interval.
(Essay)
4.7/5 (35)
Filters
- Essay(0)
- Multiple Choice(0)
- Short Answer(0)
- True False(0)
- Matching(0)