Exam 8: Regression, Associations, and Predictive Modeling
Exam 1: Exploring and Understanding Data125 Questions
Exam 2: Exploring Relationships Between Variables165 Questions
Exam 3: Gathering Data111 Questions
Exam 4: Randomness and Probability148 Questions
Exam 5: From the Data at Hand to the World at Large128 Questions
Exam 6: Accessing Associations Between Variables93 Questions
Exam 7: Inference When Variables Are Related25 Questions
Exam 8: Regression, Associations, and Predictive Modeling792 Questions
Select questions type
Suppose that a Normal model described student scores in a history class. Parker has a standardized
Score (
5) This means that Parker
(Multiple Choice)
4.8/5  (39)
(39)
Which of the following statements is NOT an assumption of inference for a regression model?
(Multiple Choice)
4.8/5 (29)
Crawling Researchers at the University of Denver Infant Study Center investigated whether babies take longer to learn to crawl in cold months (when they are often bundled in clothes that restrict their movement) than in warmer months. The study sought an association between babies' first crawling age (in weeks) and the average temperature during the month they first try to crawl (about 6 months after birth). Between 1988 and 1991 parents reported the birth month and age at which their child was first able to creep or crawl a distance of four feet in one minute. Data were collected on 208 boys and 206 girls. The graph below plots average crawling ages (in weeks) against the mean temperatures when the babies were 6 months old. The researchers found a correlation of and their line of best fit was
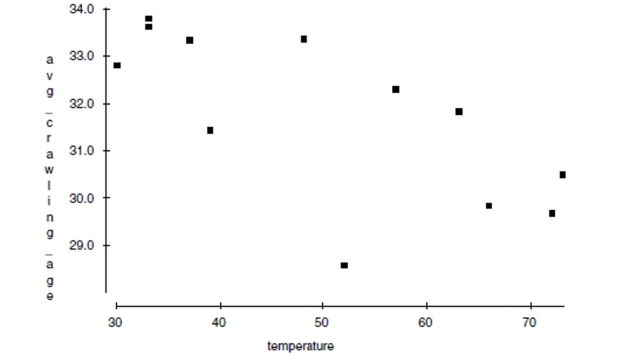 a. Draw the line of best fit on the graph. (Show your method clearly.)
b. Describe the association in context.
c. Explain (in context) what the slope of the line means.
d. Explain (in context) what the y-intercept of the line means.
e. Explain (in context) what
means.
f. In this context, what does a negative residual indicate?
a. Draw the line of best fit on the graph. (Show your method clearly.)
b. Describe the association in context.
c. Explain (in context) what the slope of the line means.
d. Explain (in context) what the y-intercept of the line means.
e. Explain (in context) what
means.
f. In this context, what does a negative residual indicate?
(Essay)
4.9/5 (43)
A basketball player has a 70% free throw percentage. Which plan could be used to simulate the
Number of free throws she will make in her next five free throw attempts?
I. Let 0,1 represent making the first shot, 2, 3 represent making the second shot,…, 8, 9 represent
Making the fifth shot. Generate five random numbers 0-9, ignoring repeats.
II. Let 0, 1, 2 represent missing a shot and 3, 4,…, 9 represent making a shot. Generate five random
Numbers 0-9 and count how many numbers are in 3-9.
III. Let 0, 1, 2 represent missing a shot and 3, 4,…, 9 represent making a shot. Generate five random
Numbers 0-9 and count how many numbers are in 3-9, ignoring repeats.
(Multiple Choice)
4.9/5 (37)
We are about to test a hypothesis using data from a well-designed study. Which is true?
I. A small P-value would be strong evidence against the null hypothesis.
II. We can set a higher standard of proof by choosing α = 10% instead of 5%.
III. If we reduce the alpha level, we reduce the power of the test.
(Multiple Choice)
4.7/5 (35)
How many times should the company expect to have to get this computer repaired over
the three-year term of the lease?
(Essay)
4.9/5 (34)
Which of the following is true about Student's t-models?
I. They are unimodal, symmetric, and bell-shaped.
II. They have fatter tails than the Normal model.
III. As the degrees of freedom increase, the t-models look more and more like the Normal.
(Multiple Choice)
4.8/5 (32)
The owner had 275 customers that day. Assuming this was a typical day for her store, what
would be the mean and standard deviation of the number of customers who buy specialty
clothes for their pet each day?
(Essay)
4.8/5 (35)
It's easy to measure the circumference of a tree's trunk, but not so easy to measure its height.
Foresters developed a model for ponderosa pines that they use to predict the tree's height (in feet)
From the circumference of its trunk (in inches):
) ) A lumberjack finds a tree with
A circumference of 60"; how tall does this model estimate the tree to be?
(Multiple Choice)
4.8/5 (43)
A scatterplot of vs. x shows a strong positive linear pattern. It is probably true that
(Multiple Choice)
4.8/5 (40)
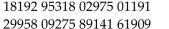
Listed at the right are the names of twenty full-time clerks on the retail staff. Use the
random numbers listed below to select four of them to be in your sample. Clearly explain
your method. Larry Marissa Tim Diane Carol Joshua Barbara Allan Rich Sharyn Brian Kelly Nicole John June Frank Steve Andrea Matthew Erin
(Essay)
4.8/5 (35)
Mistakes. Describe the mistake made in the following analyses:
a. Ten teachers compute their average test scores for all their students. Then the
superintendent collects their data and finds the school average. He repeats this process for
eight different schools and finds a positive correlation between the age of the school
average age of the teachers at a school and their average score.
b. The mayor of a city is concerned that the population of the city is growing faster than
revenue. He calculates that over the last 5 years, the year and the size of the city have a
R-sq of 95.7%. With such a high value, the mayor confidently predicts the population for
the next three years of fiscal planning.
(Essay)
4.8/5 (37)
a. Sketch a histogram of these data
b. Find the mean and standard deviation for the number of credit hours.
c. Find the median and IQR for the number of credit hours.
d. Is it more appropriate to use the mean and standard deviation or the median and IQR to
summarize theses data? Explain.
(Essay)
4.8/5 (41)
Assembly line Your new job at Panasony is to do the final assembly of camcorders. As you
learn how, you get faster. The company tells you that you will qualify for a raise if after 13
weeks your assembly time averages under 20 minutes. The data shows your average
assembly time during each of your first 10 weeks. Week Time () 1 43 2 39 3 35 4 33 5 32 6 30 7 30 8 28 9 26 10 25
a. Which is the explanatory variable?
b. What is the correlation between these variables?
c. You want to predict whether or not you will qualify for that raise. Would it be
appropriate to use a linear model? Explain.
(Essay)
4.8/5 (43)
An ice cream stand reports that 12% of the cones they sell are "jumbo" size. You want to see what a
"jumbo" cone looks like, so you stand and watch the sales for a while. What is the probability there
Is exactly 1 jumbo among the first 6 cones sold by the ice cream stand?
(Multiple Choice)
4.9/5 (40)
What is the probability that a boat is either made of wood or has chrome accents?
(Essay)
4.9/5 (30)
Use the equation difftemp time to predict the difference in temperature at time 0 minutes. What does this value represent?
(Essay)
4.9/5 (43)
To discourage cheating, a professor makes three different versions of an exam. For the 105
students in her class, she makes 35 copies of each version. The 105 exams are randomly
scrambled, and one copy is given to each student. After the exam, the professor is
concerned that one version might have been easier than the others. She uses a one-way
ANOVA to test whether the average score was different for the three versions. The
ANOVA table and a boxplot of the results are below. Source df Sums of Squares Mean Square F-ratio P-value Version 2 771.943 385.971 4.4317 0.0143 Error 102 8883.49 87.093 Total 104 9655.43
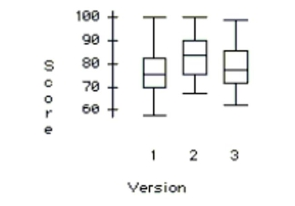 a. What hypotheses are tested by this ANOVA?
b. Write a sentence describing the conclusion of the test in the context of this problem.
c. Use the plots below to check the ANOVA conditions.
a. What hypotheses are tested by this ANOVA?
b. Write a sentence describing the conclusion of the test in the context of this problem.
c. Use the plots below to check the ANOVA conditions. 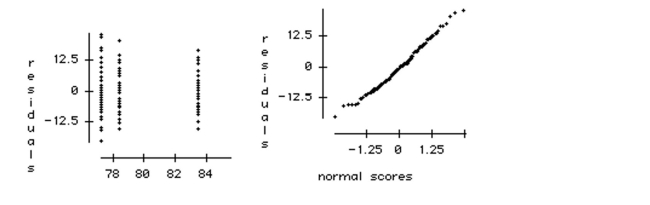
(Essay)
4.8/5 (40)
Filters
- Essay(0)
- Multiple Choice(0)
- Short Answer(0)
- True False(0)
- Matching(0)