Exam 8: Regression, Associations, and Predictive Modeling
Exam 1: Exploring and Understanding Data125 Questions
Exam 2: Exploring Relationships Between Variables165 Questions
Exam 3: Gathering Data111 Questions
Exam 4: Randomness and Probability148 Questions
Exam 5: From the Data at Hand to the World at Large128 Questions
Exam 6: Accessing Associations Between Variables93 Questions
Exam 7: Inference When Variables Are Related25 Questions
Exam 8: Regression, Associations, and Predictive Modeling792 Questions
Select questions type
Should the company conclude that the percentage of cell phone owners in this age group
who use their phone to go online is different from 63%? Explain.
(Essay)
4.8/5  (42)
(42)
A scatterplot of log(Y) vs. log(X) reveals a linear pattern with very little scatter. It is probably true
That …
(Multiple Choice)
4.8/5 (35)
Check the conditions for the regression and comment on whether or not they are satisfied.
(Essay)
4.8/5 (53)
We will test the hypothesis that versus . We don't know it, but actually is . With which sample size and significance level will our test have the greatest power?
(Multiple Choice)
4.9/5 (41)
They ignore your advice in Question 1 and just select a random sample of 300 cell phone
users aged 16 to 24, and find that 206 of those surveyed use their phone to go online. Create
the confidence interval.
(Essay)
4.9/5 (44)
Find each percent.
a) What percent of adults surveyed are social media users aged 30-49?
b) What percent of the social media users are aged 30-49?
c) What percent of adults aged 30-49 are social media users?
(Essay)
4.8/5 (32)
Over the past decade a farmer has been able to increase his wheat production by about the same
Number of bushels each year. His most useful predictive model is probably…
(Multiple Choice)
4.8/5 (32)
Suppose that our fearless fisherman goes out early one morning and casts a total of 250
times. What are the mean and standard deviation of the number of times he should receive
a nibble on his line?
(Essay)
4.9/5 (39)
City planners wanted to know how many people lived in a typical housing unit so they
compiled data from hundreds of forms that had been submitted in various city offices.
Summary statistics are shown
in the table. 2.53 people s 1.40 people min 1 Q1 1 median 2 Q3 3 10
a. Notice that the minimum occupancy and the first quartile are the same. Explain how this can be.
b. The city classifies residences housing 4 or more people as "high occupancy". Would you consider 4 occupants to be unusually high? Explain.
c. The city bases their garbage disposal fee on the occupancy level of the home or apartment. The annual fee is plus per person, so a single occupant pays and the homes with 10 people pay a year. What is the median fee paid? And the IQR?
d. What are the mean and standard deviation of the garbage disposal fees?
(Essay)
4.8/5 (31)
Approval rating A newspaper article reported that a poll based on a sample of 800 voters
showed the President's job approval rating stood at 62%. They claimed a margin of error of
%. What level of confidence were the pollsters using?
(Essay)
4.9/5 (33)
A national study found that the average family spent a month on groceries, with a standard deviation of . The average amount spent on housing (rent or mortgage) was, a month, with standard deviation . The expected total a family spends on food and housing is . What is the standard deviation of the total?
(Multiple Choice)
4.7/5 (42)
In order to see which variety of apple tree produces more fruit, a farmer sets up an experiment. He
Has three plots of land with different soil and natural water availability. Each plot has room for
Eight trees. The farmer randomly selects four locations in each plot for the first variety of tree and
The other four get the second variety. This experiment is…
(Multiple Choice)
4.7/5 (41)
Put to Work Some students have to work part time jobs to pay for college expenses. A
researcher examined the academic performance of students with jobs versus those without.
He found a positive association between the number of hours worked and GPA. Explain
what "positive association" means in this context.
(Essay)
4.8/5 (36)
The correlation coefficient between high school grade point average (GPA) and college GPA is
0)560. For a student with a high school GPA that is 2.5 standard deviations above the mean, we
Would expect that student to have a college GPA that is ______ the mean.
(Multiple Choice)
4.7/5 (35)
Write a sentence or two about the conditional relative frequency distribution of modes of
transportation for the boys.
(Essay)
4.9/5 (39)
Haircuts You need to find a new hair stylist and know that there are two terrific salons in
your area, Hair by Charles and Curl Up & Dye. You want a really good haircut, but you do
not want to pay too much for the cut. A random sample of costs for 10 different stylists was
taken at each salon (each salon employs over 100 stylists).
a. Indicate what inference procedure you would use to see if there is a significant
difference in the costs for haircuts at each salon. Check the appropriate assumptions and
conditions and indicate whether you could or could nor proceed. (Do not do the actual
test.)
b. A friend tells you that he has heard that Curl Up & Dye is the more expensive salon.
i. Write hypotheses for your friend's claim.
ii. The following are computer outputs. Which output is the correct one to use for this
test? Explain. 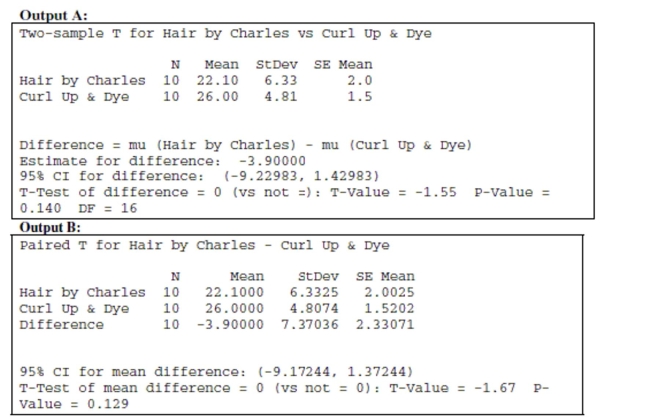 iii. Use the appropriate computer output to make a conclusion about the hypothesis
test based on the data. Make sure to state your conclusion in context.
iii. Use the appropriate computer output to make a conclusion about the hypothesis
test based on the data. Make sure to state your conclusion in context.
(Essay)
4.7/5 (39)
Which is true about sampling?
I. An attempt to take a census will always result in less bias than sampling.
II. Sampling error is usually reduced when the sample size is larger.
III. Sampling error is the result of random variations and is always present.
(Multiple Choice)
4.9/5 (37)
Compute a 95% confidence interval for the slope of the variable Weekend, and explain the
meaning of the interval in the context of the problem.
(Essay)
4.9/5 (43)
According to the Centers for Disease Control, about 36% of U.S. adults were obese in 2013.
To see if that has changed since the last study, a random sample of 250 U.S. adults will be
checked.
a. Describe the sampling distribution model for the sample proportion (assuming no
change in obesity rates) by naming the model and telling its mean and standard deviation.
Justify your answer.
b. Sketch and clearly label the model.
c. What is the probability that in this group less than 25% of the adults will be found to be
obese?
(Essay)
4.8/5 (44)
Home ownership According to the Bureau of the Census, 68.0% of Americans owned their
own homes in 2003. A local real estate office is curious as to whether a higher percentage of
Americans own their own homes in its area. The office selects a random sample of 200
people in the area to estimate the percentage of those people that own their own homes.
a. Verify that a Normal model is a useful approximation for the Binomial in this situation.
b. What is the probability that at least 140 people will report owning their own home?
c. Based on the sample, how many people would it take for you to be convinced that a
higher percentage of Americans own their own homes in that area? Explain.
(Essay)
4.8/5 (38)
Filters
- Essay(0)
- Multiple Choice(0)
- Short Answer(0)
- True False(0)
- Matching(0)