Exam 8: Regression, Associations, and Predictive Modeling
Exam 1: Exploring and Understanding Data125 Questions
Exam 2: Exploring Relationships Between Variables165 Questions
Exam 3: Gathering Data111 Questions
Exam 4: Randomness and Probability148 Questions
Exam 5: From the Data at Hand to the World at Large128 Questions
Exam 6: Accessing Associations Between Variables93 Questions
Exam 7: Inference When Variables Are Related25 Questions
Exam 8: Regression, Associations, and Predictive Modeling792 Questions
Select questions type
Describe the W's, if the information is given:
• Who:
• What:
• When:
• Where:
• How:
• Why:
(Essay)
4.8/5  (38)
(38)
Students A growing school district tracks the student population growth over the years
from 2008 to 2013. Here are the regression results and a residual plot. students year
Sample size: 6
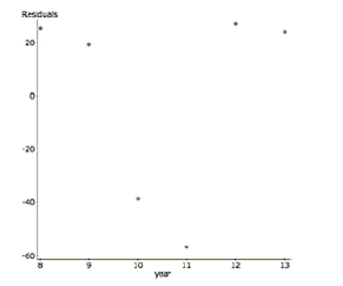 a. Explain why despite a high , this regression is not a successful model.
To linearize the data, the (base 10 ) was taken of the student population. Here are the results.
Dependent Variable: (students)
Sample size: 6
Parameter Estimate Std. Err. constant 2.871 0.0162 year 0.0389 0.00152
a. Explain why despite a high , this regression is not a successful model.
To linearize the data, the (base 10 ) was taken of the student population. Here are the results.
Dependent Variable: (students)
Sample size: 6
Parameter Estimate Std. Err. constant 2.871 0.0162 year 0.0389 0.00152
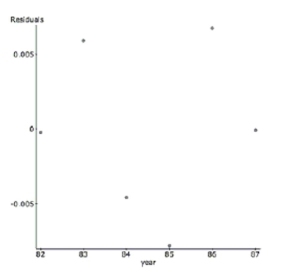 b. Describe the success of the linearization.
c. Interpret R-sq in the context of this problem.
d. Predict the student population in 2014.
b. Describe the success of the linearization.
c. Interpret R-sq in the context of this problem.
d. Predict the student population in 2014.
(Essay)
4.8/5 (34)
Show three trials by clearly labeling the random number table given below. Specify the
outcome for each trial. 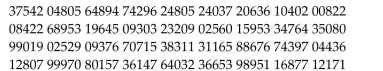
(Essay)
4.9/5 (32)
Students taking an intro stats class reported the number of credit hours that they were
taking that quarter. Summary statistics are shown in the table. 16.65 s 2.96 min 5 Q1 15 median 16 Q3 19 max 28
a. Suppose that the college charges $73 per credit hour plus a flat student fee of $35 per
quarter. For example, a student taking 12 credit hours would pay $35
that quarter.
i. What is the mean fee paid?
ii. What is the standard deviation for the fees paid?
iii. What is the median fee paid?
iv. What is the IQR for the fees paid?
b. Twenty-eight credit hours seems like a lot. Would you consider 28 credit hours to be
unusually high? Explain.
(Essay)
4.8/5 (40)
A researcher wants to compare the effect of a new type of shampoo on hair condition. The
Researcher believes that men and women may react to the shampoo differently. Additionally, the
Researcher believes that the shampoo will react differently on hair that is dyed. The subjects are
Split into four groups: men who dye their hair; men who do not dye their hair; women who dye
Their hair; women who do not dye their hair. Subjects in each group are randomly assigned to the
New shampoo and the old shampoo. This experiment
(Multiple Choice)
4.8/5 (38)
Blood pressure Researchers developing new drugs must be concerned about possible side
effects. They must check a new medication for arthritis to be sure that it does not cause an
unsafe increase in blood pressure. They measure the blood pressures of a group of 12
subjects, then administer the drug and recheck the blood pressures one hour later. The
drug will be approved for use unless there is evidence that blood pressure has increased an
average of more than 20 points. They will test a hypothesis using
a. Write appropriate hypotheses (in words and in symbols).
b. In this context, which do you consider to be more serious - a Type I or a Type II error?
Explain briefly.
c. After this experiment produced inconclusive results the researchers decided to test the
drug again another group of patients. Describe two changes they could make in their
experiment to increase the power of their test, and explain the disadvantages of each.
(Essay)
4.8/5 (31)
Which of these is not an advantage of using a stratified sample instead of a simple random sample?
(Multiple Choice)
4.8/5 (36)
According to the American Pet Products Manufacturers Association (APPMA) 2003- 2004
National Pet Owners Survey, 39% of U.S. households own at least one dog and 34% of U.S. households own at least one cat. Assume that 60% of U.S. households own a cat or a dog.
a. What is the probability that a randomly selected U.S. household owns neither a cat nor a
dog?
b. What is the probability that a randomly selected U.S. household owns both a cat and a
dog?
c. What is the probability that a randomly selected U.S. household owns a cat if the
household has a dog?
(Essay)
4.8/5 (36)
There is a proposal to replace the shortest roller coaster above with one that has a length of
1,200 ft. Indicate whether changing that roller coaster's length would make each of these
summary statistics increase, decrease, or stay about the same.
a. mean
b. median
c. range
d. IQR
e. standard deviation
(Essay)
4.8/5 (28)
The average scores for Wisconsin schools on the ACT are summarized in the ogive shown. Estimate
The IQR of the average scores. 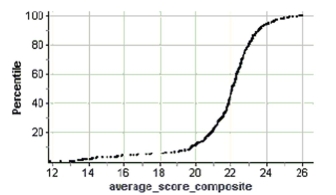
(Multiple Choice)
4.7/5 (42)
A contact lens wearer read that the producer of a new contact lens boasts that their lenses are
Cheaper than contact lenses from another popular company. She collected some data, then tested
The null hypothesis H0: µold µnew = 0 against the alternative HA: µold - µnew > 0. Which of the
Following would be a Type II error?
(Multiple Choice)
4.8/5 (38)
Which of these variables is most likely to follow a Normal model?
(Multiple Choice)
4.7/5 (36)
Double-blinding in experiments is important so that
I. The evaluators do not know which treatment group the participants are in.
II. The participants do not know which treatment group they are in.
III. No one knows which treatment any of the participants is getting.
(Multiple Choice)
4.8/5 (24)
Write a sentence or two about the conditional relative frequency distribution of ages of
social media users.
(Essay)
4.9/5 (36)
Earning power A college's job placement office collected data about students' GPAs and
the salaries they earned in their first jobs after graduation. The mean GPA was 2.9 with a
standard deviation of 0.4. Starting salaries had a mean of $47,200 with a SD of $8500. The
correlation between the two variables was r = 0.72. The association appeared to be linear in
the scatterplot. (Show work)
a. Write an equation of the model that can predict salary based on GPA.
b. Do you think these predictions will be reliable? Explain.
c. Your brother just graduated from that college with a GPA of 3.30. He tells you that based
on this model the residual for his pay is -$1880. What salary is he earning?
(Essay)
4.8/5 (33)
Soda cans A machine that fills cans with soda fills according to a Normal model with mean
12.1 ounces and standard deviation 0.05 ounces.
a. If the cans claim to have 12 ounces of soda each, what percent of cans are under-filled?
b. Management wants to ensure that only 1% of cans are under-filled.
i. Scenario 1: If the mean fill of the cans remains at 12.1 ounces, what standard
deviation does the filling machine need to have to achieve this goal?
ii. Scenario 2: If the standard deviation is to remain at 0.05 ounces, what mean does the
filling machine need to have to achieve this goal?
(Essay)
4.9/5 (30)
In this context describe a Type II error and the impact such an error would have on the
company.
(Essay)
4.9/5 (35)
Veterinary costs Costs for standard veterinary services at a local animal hospital follow a
Normal model with a mean of $80 and a standard deviation of $20.
a. Draw and clearly label this model.  b. Is it unusual to have a veterinary bill for $125? Explain.
c. What is the IQR for the costs of standard veterinary services? Show your work
b. Is it unusual to have a veterinary bill for $125? Explain.
c. What is the IQR for the costs of standard veterinary services? Show your work
(Essay)
4.9/5 (35)
Suppose that a Normal model describes the acidity (pH) of rainwater, and that water tested after
Last week's storm had a z-score of 1.8. This means that the acidity of that rain …
(Multiple Choice)
4.9/5 (26)
Filters
- Essay(0)
- Multiple Choice(0)
- Short Answer(0)
- True False(0)
- Matching(0)