Exam 8: Regression, Associations, and Predictive Modeling
Exam 1: Exploring and Understanding Data125 Questions
Exam 2: Exploring Relationships Between Variables165 Questions
Exam 3: Gathering Data111 Questions
Exam 4: Randomness and Probability148 Questions
Exam 5: From the Data at Hand to the World at Large128 Questions
Exam 6: Accessing Associations Between Variables93 Questions
Exam 7: Inference When Variables Are Related25 Questions
Exam 8: Regression, Associations, and Predictive Modeling792 Questions
Select questions type
Heights of adults According to the National Health Survey, heights of adults may have a
Normal model with mean heights of 69.1" for men and 64.0" for women. The respective
standard deviations are 2.8" and 2.5."
a. Based on this information,
i. how much taller are men than women, on average?
ii. what is the standard deviation for the difference in men's and women's heights?
b. Assume that women date men without considering the height of the man (i.e., that the
heights of the couple are independent). What is the probability that a woman dates a man
shorter than she is?
(Essay)
4.8/5  (37)
(37)
Describe how you will use a random number table to conduct this simulation.
(Essay)
4.9/5 (36)
Is there evidence of a significant relationship between number of classes and GPA? Provide
statistical justification for your answer.
(Essay)
4.8/5 (26)
Hardwood mulch Hardwood mulch is sold by the cubic yard. (But they just call it 'yards'
to be confusing.) One lawn and garden store has a truck that they say can carry up to 7
yards for delivery. (It can actually hold a bit more.) Of course, when they fill the truck they
don't get exactly 7 yards of mulch. They weigh it to determine the actual amount for billing
purposes. They charge $28 per yard for the mulch, plus $25 for delivery
a. Shown are some summary statistics describing the distribution of the actual amounts of
mulch in full loads. Fill in the table to include those statistics for the cost including
delivery. Statistic Yards Of Mulch Cost incl. Delivery Mean 7.1 Standard deviation 0.18 Q1 6.8 Median 7.2 IQR 0.5
b. Your delivery is among this set of data, and it has a z-score of -0.84 for the distribution
of yards of mulch. What is your z-score for the cost including delivery?
(Essay)
4.8/5 (36)
The length of a cat's tail is roughly normally distributed with a mean of 5" and a standard deviation
Of 2". The probability of having a cat with a 3.5" tail or shorter is…
(Multiple Choice)
4.9/5 (35)
Computer output in the scenario described in problem #8 reports that . Which is the correct
Interpretation of this value?
(Multiple Choice)
4.8/5 (40)
Another farmer has increased his wheat production by about the same percentage each year. His
Most useful predictive model is probably…
(Multiple Choice)
4.9/5 (34)
The ages of people attending the opening show of a new movie are summarized in the ogive
Shown. Estimate the IQR of the ages. 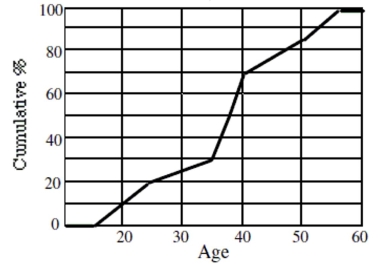
(Multiple Choice)
4.8/5 (35)
Aggressiveness A recent study evaluated elementary age children for aggressiveness. This
study found that the children who played video games were more likely to engage in
aggressive or violent play at school. The researchers said the difference was statistically
significant.
a. Briefly explain what "statistically significant" means in this context.
b. The news media reported that this study proved that playing computer games causes
children to be aggressive or violent. Briefly explain why this conclusion is not justified.
c. But perhaps it is true. We wonder if playing computer games can lead to aggressive or
violent behavior in elementary school children. We find 50 young children whose families
volunteer to participate in our research. Design an appropriate experiment. (You need not
explain how to randomize.)
(Essay)
4.8/5 (34)
The side-by-side boxplots show the cumulative college GPAs for sophomores, juniors, and
seniors taking an intro stats course in Autumn 2003. 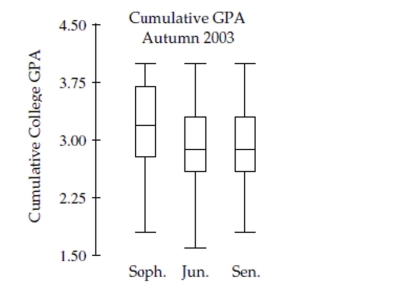 a. Which class (sophomore, junior, or senior) had the lowest cumulative college GPA?
What is the approximate value of that GPA?
b. Which class has the highest median GPA, and what is that GPA?
c. Which class has the largest range for GPA, and what is it?
d. Which class has the most symmetric set of GPAs? The most skewed set of GPAs?
a. Which class (sophomore, junior, or senior) had the lowest cumulative college GPA?
What is the approximate value of that GPA?
b. Which class has the highest median GPA, and what is that GPA?
c. Which class has the largest range for GPA, and what is it?
d. Which class has the most symmetric set of GPAs? The most skewed set of GPAs?
(Essay)
4.9/5 (38)
A business owner notes that for every extra hour his store is open, his total sales increase by a fixed
Amount. His most useful predictive model is probably...
(Multiple Choice)
4.9/5 (35)
In this context describe a Type II error and the impact such an error would have on the
company.
(Essay)
4.8/5 (35)
Find a 95% confidence interval for the number of credit hours taken by the students in the
professor's class. Interpret your interval.
(Essay)
4.9/5 (36)
A Columbia University study linked soda consumption to behavior problems in children.
Researchers examined data from a previous study that followed 2929 mother-child pairs. One
Survey asked about behaviors of the child and also about soda consumption. They found that the
More soda the kids drank, the more behavior problems they had. What aspect of a well-designed
Experiment is absent from this study?
(Multiple Choice)
4.9/5 (46)
A school board study found a moderately strong negative association between the number
of hours high school seniors worked at part-time jobs after school hours and the students'
grade point averages.
a. Explain in this context what "negative association" means.
b. Hoping to improve student performance, the school board passed a resolution urging
parents to limit the number of hours students be allowed to work. Do you agree or
disagree with the school board's reasoning. Explain.
(Essay)
4.9/5 (30)
In predicting the growth of the volume of a small bay by measuring the height of the water at a Dock, a researcher is using a model of  = 2.34 + 4.56( height )
Where height is measured in m And volume cubic miles. If the height rises to 3.45 m, what is the predicted volume?
= 2.34 + 4.56( height )
Where height is measured in m And volume cubic miles. If the height rises to 3.45 m, what is the predicted volume?
(Multiple Choice)
4.9/5 (35)
A survey of some AP* Stats students recorded gender and whether the student was left or
Right-handed. Results were summarized in a table like the one shown. If it turned out that
Handedness was independent of gender, how many of the AP* Stats students were lefty girls? 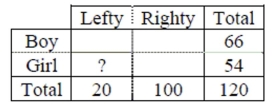
(Multiple Choice)
4.7/5 (28)
At a large business, employees must report to work at 7:30 A.M. The arrival times of
employees can be described by a Normal model with mean of 7:22 A.M. and a standard
deviation of 4 minutes.
(SHOW WORK)
a. What percent of employees are late on a typical work day?
b. A psychological study determined that the typical worker needs five minutes to adjust to
their surroundings before beginning their duties. What percent of this business' employees
arrive early enough to make this adjustment?
c. Because late employees are a distraction and cost companies money, all employees need
to be on time to work. If the mean arrival time of employees does not change, what
standard deviation would the arrival times need to ensure virtually all employees are on
time to work?
d. Explain what achieving a smaller standard deviation means in the context of this
problem.
(Essay)
4.8/5 (40)
Which is true?
I. Random scatter in the residuals indicates a model with high predictive power.
II. If two variables are very strongly associated, then the correlation between them will be near +1.0
Or -1.0.
III. The higher the correlation between two variables the more likely the association is based in
Cause and effect.
(Multiple Choice)
4.7/5 (31)
Filters
- Essay(0)
- Multiple Choice(0)
- Short Answer(0)
- True False(0)
- Matching(0)