Exam 8: Regression, Associations, and Predictive Modeling
Exam 1: Exploring and Understanding Data125 Questions
Exam 2: Exploring Relationships Between Variables165 Questions
Exam 3: Gathering Data111 Questions
Exam 4: Randomness and Probability148 Questions
Exam 5: From the Data at Hand to the World at Large128 Questions
Exam 6: Accessing Associations Between Variables93 Questions
Exam 7: Inference When Variables Are Related25 Questions
Exam 8: Regression, Associations, and Predictive Modeling792 Questions
Select questions type
Describe how you will use a random number table to conduct this simulation.
(Essay)
4.8/5  (32)
(32)
The students in a biology class kept a record of the height (in centimeters) of plants for a
class experiment. 49 67 38 55 62 54 36 41 56 43 48 75 44 60 48 52 48 53 59 32
a. Sketch a histogram for these data.
b. Find the mean and standard deviation of the plant heights.
c. Is it appropriate to use the mean and standard deviation to summarize these data?
Explain.
d. Describe the association of plant heights.
(Essay)
4.9/5 (37)
Based on the graph and the regression output, what conclusions do you draw regarding
the relationship between age and the number of pieces of candy a trick-or-treater collects?
(Essay)
4.8/5 (35)
Based on the data they collected during the trial the research department found that a 98%
confidence interval for the proportion of all consumers who might buy Crest toothpaste
was (16%, 28%). What conclusion should the company reach about the new marketing
campaign? Explain.
(Essay)
4.7/5 (37)
Cats and dogs The table shows whether students in an introductory statistics class like
dogs and/or cats. 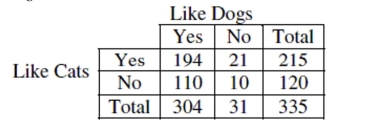 a. What is the marginal distribution (in %) of "liking dogs"?
b. What is the conditional distribution (in %) of "liking dogs" for students who like cats?
c. What kind of display(s) would you use to examine the association between "liking dogs"
and "liking cats"? (Just name a graph.)
d. Do "liking dogs" and "liking cats" appear to be independent? Give statistical evidence to
support your conclusion.
a. What is the marginal distribution (in %) of "liking dogs"?
b. What is the conditional distribution (in %) of "liking dogs" for students who like cats?
c. What kind of display(s) would you use to examine the association between "liking dogs"
and "liking cats"? (Just name a graph.)
d. Do "liking dogs" and "liking cats" appear to be independent? Give statistical evidence to
support your conclusion.
(Essay)
4.7/5 (34)
Find each percent.
a. What percent of the responses were from males who favor Labradors?
b. What percent of the male responses favor Labradors?
c. What percent of the people who choose Labradors were males?
(Essay)
4.8/5 (38)
Create and interpret a 95% confidence interval for the slope of the regression line.
(Essay)
4.8/5 (33)
Math and Verbal Suppose the correlation between SAT Verbal scores and Math scores is
0.57 and that these scores are normally distributed. If a student's Verbal score places her at
the 90th percentile, at what percentile would you predict her Math score to be?
(SHOW WORK)
(Essay)
4.8/5 (32)
Carpet A store selling carpet tracks the amount of square footage sold to its customers,
rounding to the nearest 500 sq. ft. Here is the distribution. area 500 sq. ft. 1000 sq. ft. 1500 sq. ft. 2000+ sq. ft. probability 0.10 0.25 0.45 0.20
a. What is the average expected area sold?
b. If the average cost of carpet sold is $3/sq. ft., what is the average sale price per customer?
c. If a salesman completes sales to five customers one day, what do you expect his total
sales to be?
(Essay)
4.8/5 (36)
The boxplots show prices of used cars (in thousands of dollars) advertised for sale at three
different car dealers. 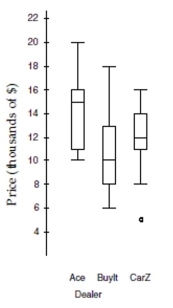 a. Which dealer offers the cheapest car offered, and at what price?
b. Which dealer has the lowest median price, and how much is it?
c. Which dealer has the smallest price range, and what is it?
d. Which dealer's prices have the smallest IQR, and what is it?
e. Which dealer generally sells cars cheapest? Explain.
a. Which dealer offers the cheapest car offered, and at what price?
b. Which dealer has the lowest median price, and how much is it?
c. Which dealer has the smallest price range, and what is it?
d. Which dealer's prices have the smallest IQR, and what is it?
e. Which dealer generally sells cars cheapest? Explain.
(Essay)
4.8/5 (37)
It takes a while for new factory workers to master a complex assembly process. During the first
Month new employees work, the company tracks the number of days they have been on the job and
The length of time it takes them to complete an assembly. The correlation is most likely to be
(Multiple Choice)
4.7/5 (30)
A coffee house owner knows that customers pour different amounts of coffee into their cups. She Samples cups from 10 costumers she believes to be representative of the customers and weighs the Cups, finding a mean of 12.5 ounces and standard deviation of 0.5 ounces. Assuming these cups of Coffee can be considered a random sample of all cups of coffee which of the following formulas Gives a 95% confidence interval for the mean weight of all cups of coffee?
(Multiple Choice)
4.9/5 (41)
Some marathons allow two runners to "split" the marathon by each running a half marathon. Alice
And Sharon plan to split a marathon. Alice's half-marathon times average 92 minutes with a
Standard deviation of 4 minutes, and Sharon's half-marathon times average 96 minutes with a standard deviation of 2 minutes. Assume that the women's half-marathon times are independent.
The expected time for Alice and Sharon to complete a full marathon is 92
8 minutes. What
Is the standard deviation of
Their total time?
(Multiple Choice)
4.9/5 (37)
The American Veterinary Association claims that the annual cost of medical care for dogs
averages $100 with a standard deviation of $30, and for cats averages $120 with a standard
deviation of $35.
a. Find the expected value for the annual cost of medical care for a person who has one dog
and one cat.
b. Find the standard deviation for the annual cost of medical care for a person who has one
dog and one cat.
c. Suppose that a couple owns four dogs.
i. Find the expected value for the annual cost of medical care for the couple's dogs.
ii. Find the standard deviation for the annual cost of medical care for the couple's dogs.
(Essay)
4.7/5 (37)
As you wait your turn in line there are three gold winners in a row. A lively discussion
ensues between the next two customers. One thinks that streak about kills her chances of
winning free merchandise, as the wheel won't come up gold again for a very long time.
The other says that the wheel is clearly on a hot streak, so they are lucky to be next in line.
Comment on their opinions.
(Essay)
4.8/5 (47)
Filters
- Essay(0)
- Multiple Choice(0)
- Short Answer(0)
- True False(0)
- Matching(0)