Exam 8: Regression, Associations, and Predictive Modeling
Exam 1: Exploring and Understanding Data125 Questions
Exam 2: Exploring Relationships Between Variables165 Questions
Exam 3: Gathering Data111 Questions
Exam 4: Randomness and Probability148 Questions
Exam 5: From the Data at Hand to the World at Large128 Questions
Exam 6: Accessing Associations Between Variables93 Questions
Exam 7: Inference When Variables Are Related25 Questions
Exam 8: Regression, Associations, and Predictive Modeling792 Questions
Select questions type
The standard deviation of the data displayed in this dotplot is closest to… 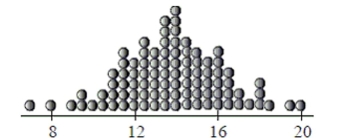
(Multiple Choice)
4.9/5  (35)
(35)
Concrete thickness A roadway construction process uses a machine that pours concrete
onto the roadway and measures the thickness of the concrete so the roadway will measure
up to the required depth in inches. The concrete thickness needs to be consistent across the
road, but the machine isn't perfect and it is costly to operate. Since there's a safety hazard if
the roadway is thinner than the minimum 23 inch thickness, the company sets the machine
to average 26 inches for the batches of concrete. They believe the thickness level of the
machine's concrete output can be described by a Normal model with standard deviation
1.75 inches. [Show work]
a. What percent of the concrete roadway is under the minimum depth?
b. The company's lawyers insist that no more than 3% of the output be under the limit.
Because of the expense of operating the machine, they cannot afford to reset the mean to a
higher value. Instead they will try to reduce the standard deviation to achieve the "only 3%
under" goal. What standard deviation must they attain?
c. Explain what achieving a smaller standard deviation means in this context.
(Essay)
4.9/5 (42)
Do you think that milk consumption by young girls is independent of the nationwide
survey year? Use statistics to justify your reasoning.
(Essay)
4.9/5 (35)
Which of the following summaries are changed by adding a constant to each data value?
I. the mean
II. the median
III. the standard deviation
(Multiple Choice)
4.9/5 (37)
The body temperature of students is taken each time a student goes to the nurse's office.
The five-number summary for the temperatures (in degrees Fahrenheit) of students on a
particular day is: Min Q1 Median Q3 Max 96. 97.8 98.2 98. 101.
a. Would you expect the mean temperature of all students who visited the nurse's office to
be higher or lower than the median? Explain.
b. After the data were picked up in the afternoon, three more students visited the nurse's
office with temperatures of 96.7°, 98.4°, and 99.2°. Were any of these students outliers
(according to the original statistics above)? Explain.
(Essay)
4.8/5 (37)
To see if your school's ACT scores are improving since implementing a new program, the ACT
Scores for the past several years should be displayed in a
(Multiple Choice)
4.7/5 (35)
The five-number summary for the weights (in pounds) of fish caught in a bass tournament
is: Min Q1 Median Q3 Max 2.3 2.8 3.0 3.3 4.5
a. Would you expect the mean weight of all fish caught to be higher or lower than the
median? Explain.
b. You caught 3 bass weighing 2.3 pounds, 3.9 pounds, and 4.2 pounds. Were any of your
fish outliers (according to the original statistics above)? Explain.
(Essay)
4.8/5 (41)
Email At CPU every student gets a college email address. Data collected by the college
showed a negative association between student grades and the number of emails the
student sent during the semester.
a. Briefly explain what "negative association" means in this context.
b. After seeing this study the college proposes trying to improve academic performance by
limiting the amount of email students can send through the college address. As a
statistician, what do you think of this plan? Explain briefly.
(Essay)
4.7/5 (32)
Pumpkin pie A can of pumpkin pie mix contains a mean of 30 ounces and a standard
deviation of 2 ounces. The contents of the cans are normally distributed. What is the
probability that four randomly selected cans of pumpkin pie mix contain a total of more
than 126 ounces?
(Essay)
4.8/5 (42)
An elementary school principal wants to know the mean number of children in families whose
Children attend this school. He checks all the families using the school's registration records, and we
Create a 95% confidence interval based on a t-distribution. This procedure was not appropriate.
Why?
(Multiple Choice)
4.8/5 (39)
We wish to compare the average ages of the math and science teachers at your high school. Which
Is the best way to collect the data?
(Multiple Choice)
4.8/5 (37)
A soft drink company is conducting research to select a new design for the can. A random
sample of participants has been selected. Instead of a typical taste test with two different
sodas, they actually give each participant the same soda twice. One drink is served in a
predominantly red can, the other in a predominantly blue can. The order is chosen
randomly. Participants are asked to rate each drink on a scale of 1 to 10. Thus, the company
wishes to test if the color of the can influences the rating. The ratings were recorded for
each participant. The data are shown in the table below. Does this sample indicate that
there is a difference in the ratings? Test an appropriate hypothesis and state your
conclusion. Rater Red Blue 1 4 6 2 7 5 3 3 6 4 8 9 5 5 2 6 9 9 7 7 10 8 5 4 9 6 8 10 9 7 11 8 8 12 3 7 13 6 5 14 8 8 15 9 10 16 7 6
(Essay)
4.8/5 (34)
The representatives from the Department of Labor want to estimate a percentage of
females in the United States labor force to within
with 90% confidence. How many
employment records should they sample?
(Essay)
4.8/5 (29)
A residuals plot is useful because
I. it will help us to see whether our model is appropriate.
II. it might show a pattern in the data that was hard to see in the original scatterplot.
III. it will clearly identify influential points.
(Multiple Choice)
4.9/5 (40)
Environmental researchers have collected rain acidity data for several decades. They want to see if
There is any evidence that attempts to reduce industrial pollution have produced a trend toward
Less acidic rainfall. They should display their data in a(n)…
(Multiple Choice)
4.7/5 (41)
College admissions According to information from a college admissions office, 62% of the
students there attended public high schools, 26% attended private high schools, 2% were
home schooled, and the remaining students attended schools in other countries. Among
this college's Honors Graduates last year there were 47 who came from public schools, 29
from private schools, 4 who had been home schooled, and 4 students from abroad. Is there
any evidence that one type of high school might better equip students to attain high
academic honors at this college? Test an appropriate hypothesis and state your conclusion.
(Essay)
4.9/5 (35)
The correlation between a family's weekly income and the amount they spend on restaurant meals
Is found to be r = 0.30. Which must be true?
I. Families tend to spend about 30% of their incomes in restaurants.
II. In general, the higher the income, the more the family spends in restaurants.
III. The line of best fit passes through 30% of the (income, restaurant$) data points.
(Multiple Choice)
4.9/5 (33)
Filters
- Essay(0)
- Multiple Choice(0)
- Short Answer(0)
- True False(0)
- Matching(0)