Exam 8: Regression, Associations, and Predictive Modeling
Exam 1: Exploring and Understanding Data125 Questions
Exam 2: Exploring Relationships Between Variables165 Questions
Exam 3: Gathering Data111 Questions
Exam 4: Randomness and Probability148 Questions
Exam 5: From the Data at Hand to the World at Large128 Questions
Exam 6: Accessing Associations Between Variables93 Questions
Exam 7: Inference When Variables Are Related25 Questions
Exam 8: Regression, Associations, and Predictive Modeling792 Questions
Select questions type
Which is true of the data whose distribution is shown? 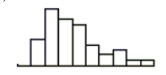 I. The distribution is skewed to the right.
II) The mean is probably smaller than the median.
III) We should summarize with mean and standard deviation.
I. The distribution is skewed to the right.
II) The mean is probably smaller than the median.
III) We should summarize with mean and standard deviation.
(Multiple Choice)
4.9/5  (38)
(38)
Your Stats teacher tells you your test score was the 3rd quartile for the class. Which is true?
I. You got 75% on the test.
II. You can't really tell what this means without knowing the standard deviation.
III. You can't really tell what this means unless the class distribution is nearly Normal.
(Multiple Choice)
4.8/5 (34)
Which statement correctly compares t-distributions to the normal distribution?
I. t distributions are also mound shaped and symmetric.
II. t distributions have less spread than the normal distribution.
III. As degrees of freedom increase, the variance of t distributions becomes smaller.
(Multiple Choice)
4.8/5 (37)
Describe the W's, if the information is given:
• Who:
• What:
• When:
• Where:
• How:
• Why:
(Essay)
4.8/5 (30)
According to Gallup, about 33% of Americans polled said they frequently experience stress
in their daily lives. Suppose you are in a class of 45 students.
a. What is the probability that no more than 12 students in the class will say that they
frequently experience stress in their daily lives? (Make sure to identify the sampling
distribution you use and check all necessary conditions.)
b. If 20 students in the class said they frequently experience stress in their daily lives,
would you be surprised? Explain, and use statistics to support your answer.
(Essay)
4.9/5 (43)
List the variables. Indicate whether each variable is categorical or quantitative. If the
variable is quantitative, tell the units.
(Essay)
4.9/5 (32)
Cereal A box of Raspberry Crunch cereal contains a mean of 13 ounces with a standard
deviation of 0.5 ounce. The distribution of the contents of cereal boxes is approximately
Normal. What is the probability that a case of 12 cereal boxes contains a total of more than
160 ounces?
(Essay)
4.7/5 (34)
The five-number summary for midterm scores (number of points; the maximum possible
score was 50 points) from an intro stats class is: Min 1 Median Q3 Max 16.5 32 39 43.5 48.5
a. Would you expect the mean midterm score of all students who took the midterm to be
higher or lower than the median? Explain.
b. Based on the five-number summary, are any of the midterm scores outliers? Explain.
(Essay)
4.7/5 (35)
Which of these variables about German Shepherds is most likely to be described by a Normal
Model?
(Multiple Choice)
4.9/5 (36)
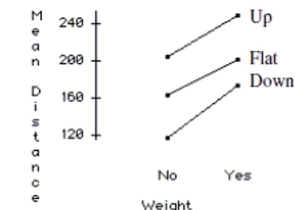
A student wants to build a paper airplane that gets maximum flight distance. She tries
three ways of bending the wing (down, flat, and up) and two levels of nose weight (no and yes
- a paper clip). She randomizes the 12 runs (each condition replicated twice). The analysis
of variance for the 12 runs is shown in the table below along with an interaction plot and
tables of the mean distance for the different wing bends and weights. Source df Sums of Squares Mean Square F-ratio P-value Wing Bend 2 13565.2 6782.58 152.7 <0.0001 Weight 1 6768.75 6768.75 152.39 <0.0001 Interaction 2 186.5 93.25 2.0994 0.2036 Error 6 266.5 44.4167 Total 11 20786.9 Wing Bend Expected Mean Down 145.0 Flat 182.5 Up 227.2 Weight Expected Mean No 161.2 Yes 208.7
 a. Does an additive model seem adequate? Explain.
b. Write a report on this analysis of the data. Include any recommendations you would
give the student on designing the plane.
a. Does an additive model seem adequate? Explain.
b. Write a report on this analysis of the data. Include any recommendations you would
give the student on designing the plane.
(Essay)
4.8/5 (40)
Suppose the state decides to randomly test high school wrestlers for steroid use. There are 16 teams
In the league, and each team has 20 wrestlers. State investigators plan to test 32 of these athletes by
Randomly choosing two wrestlers from each team. Is this a simple random sample?
(Multiple Choice)
4.9/5 (49)
A random sample of 120 classrooms at a large university found that 70% of them had been cleaned
Properly. What is the standard error of the sample proportion?
(Multiple Choice)
4.8/5 (36)
BatCo, a company that sells batteries, claims that 99.5% of their batteries are in working order. How
Many would you expect to buy, on average, to find one that does not work?
(Multiple Choice)
5.0/5 (34)
A random sample of 76 apartments is collected near a university. All of the apartments in the sample have between 1 and 6 bedrooms. The variables recorded for each apartment are Rent (in dollars) and the number of Bedrooms. The regression output is:
The dependent variable is Rent
R squared R squared (adjusted)
with degrees of freedom
Variable Coeff SE(Coeff) t-ratio p-value Constant 357.795 111.6 3.2 0.0020 Bedrooms 400.554 36.42 11.0 <0.0001
a. Write out the regression equation.
b. Compute a 95% confidence interval for the coefficient of Bedrooms. Explain your
confidence interval in the context of the problem.
c. Based on your interval is the number of bedrooms a significant predictor of rent? Explain
how you reached your answer.
d. Explain the meaning of the regression intercept in the context of this problem.
e. Use the plots below to check the regression conditions. 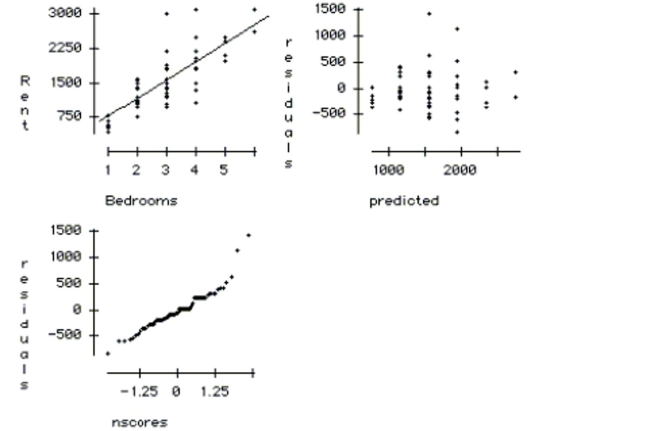
(Essay)
4.9/5 (47)
Doors When trying to reduce energy costs for a home, one strategy is to install high quality
doors. A consumer service wants to test two brands (A and
B) of doors to see which is more
effective at preventing loss of heat. They have four doors of each brand they will install in a
small cabin built for this purpose. The cabin has places for four doors on the north wall and
four on the south wall. The inside of the cabin will be heated, and monitors will be placed
outside each door to measure the amount of heat loss.
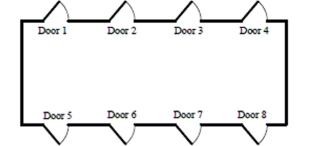 a. Use the random numbers given to decide which doors to to put in which position.
Explain your method clearly.
a. Use the random numbers given to decide which doors to to put in which position.
Explain your method clearly.
 b. Briefly explain why your assignment strategy is important in helping the manager assess
the effectiveness of the doors.
b. Briefly explain why your assignment strategy is important in helping the manager assess
the effectiveness of the doors.
(Essay)
4.9/5 (36)
Here is the regression with both Latitude and Longitude as predictors: Dependent variable is: JanTemp
squared squared (adjusted)
with degrees of freedom
Source Sum of Squares df Mean Square F-ratio Regression 7277.18 2 3638.59 74.2 Residual 2548.35 52 49.0067 Variable Coefficient SE(Coeff) t-ratio P-value Intercept 98.5620 8.473 11.6 \leq0.0001 Lat -2.16286 0.1776 -12.2 \leq0.0001 Long 0.134471 0.0641 2.10 0.0407
The coefficient of Long in this regression differs from the coefficient of Long in the simple
regression of JanTemp on Long. What is the meaning of the coefficient of Long in this
regression? Are you confident (
that the coefficient is not zero? Why or why
not?
(Essay)
5.0/5 (39)
A lakeside restaurant found the correlation between the daily temperature and the number of
Meals they served to be 0.40. On a day when the temperature is two standard deviations above the
Mean, the number of meals they should plan on serving is _?_ the mean.
(Multiple Choice)
4.7/5 (34)
A chemistry professor who teaches a large lecture class surveys his students who attend his class
About how he can make the class more interesting, hoping he can get more students to attend. This
Survey method suffers from
(Multiple Choice)
4.9/5 (40)
What is the probability that a customer gets at least a 40% discount?
(Essay)
4.7/5 (39)
Filters
- Essay(0)
- Multiple Choice(0)
- Short Answer(0)
- True False(0)
- Matching(0)