Exam 8: Regression, Associations, and Predictive Modeling
Exam 1: Exploring and Understanding Data125 Questions
Exam 2: Exploring Relationships Between Variables165 Questions
Exam 3: Gathering Data111 Questions
Exam 4: Randomness and Probability148 Questions
Exam 5: From the Data at Hand to the World at Large128 Questions
Exam 6: Accessing Associations Between Variables93 Questions
Exam 7: Inference When Variables Are Related25 Questions
Exam 8: Regression, Associations, and Predictive Modeling792 Questions
Select questions type
Find a 99% confidence interval for the difference in the proportion of Britons and
Canadians who read at least one book in the last year. Interpret your interval.
(Essay)
4.7/5  (34)
(34)
A fair coin has come up "heads" 10 times in a row. The probability that the coin will come up heads
On the next flip is
(Multiple Choice)
5.0/5 (40)
All airline passengers must pass through security screenings, but some are subjected to
additional searches as well. Some travelers who carry laptops wonder if that makes them
more likely to be searched. Data for 420 passengers aboard a cross-country flight are
summarized in the table shown. Does it appear that being subjected to an additional search
is independent of carrying a laptop computer? Explain. 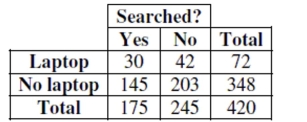
(Essay)
4.8/5 (37)
Doctors at a technology research facility randomly assigned equal numbers of people to use computer keyboards in two rooms. In one room a group of people typed a manuscript using standard keyboards, while in the other room people typed the same manuscript using ergonomic keyboards to see if those people could type more words per minute. After collecting data for several days the researchers tested the hypothesis against the one-tail alternative and found . Which is true?
(Multiple Choice)
4.8/5 (40)
Suppose a school district decides to randomly test high school students for attention deficit
Disorder (ADD). There are three high schools in the district, each with grades 9-12. The school
Board pools all of the students together and randomly samples 250 students. Is this a simple
Random sample?
(Multiple Choice)
4.8/5 (31)
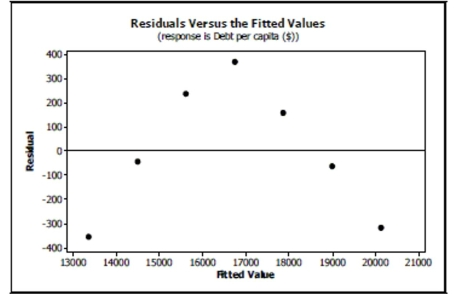
Personal debt According to The World Almanac and Book of Facts 2004, the debt per capita
for the years 1990-2001 gives the following scatterplot: 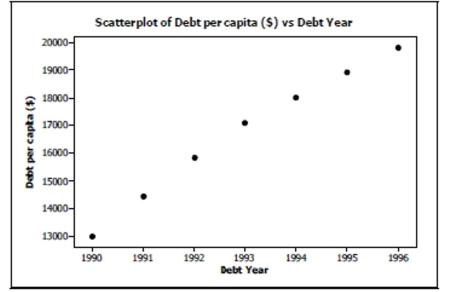 Regression output gives the equation of the regression line as
Debt (Year) with .
a. What is the response variable?
b. What is the correlation coefficient ?
c. Explain in context what the slope of the line means.
d. Explain in context what means.
e. You decide to take a look at a residuals plot before making any predictions. Based on the following residuals plot, does linear regression seem appropriate for these data?
Explain.
Regression output gives the equation of the regression line as
Debt (Year) with .
a. What is the response variable?
b. What is the correlation coefficient ?
c. Explain in context what the slope of the line means.
d. Explain in context what means.
e. You decide to take a look at a residuals plot before making any predictions. Based on the following residuals plot, does linear regression seem appropriate for these data?
Explain.
(Essay)
4.9/5 (40)
The boxplots show fuel economy of 2011 model cars for the classes shown.  a. Which class offers the car with the best gas mileage, and what is the mileage of that car?
b. Which class has the highest median gas mileage, and how much is it?
c. Which class of car has the smallest range of fuel economy, and what is it?
d. Which class of car has the smallest IQR, and what is it?
e. Which class of car generally gets the best mileage? Explain.
a. Which class offers the car with the best gas mileage, and what is the mileage of that car?
b. Which class has the highest median gas mileage, and how much is it?
c. Which class of car has the smallest range of fuel economy, and what is it?
d. Which class of car has the smallest IQR, and what is it?
e. Which class of car generally gets the best mileage? Explain.
(Essay)
5.0/5 (41)
Which statement about bias is true?
I. Bias results from random variation and will always be present.
II. Bias results from a sampling method likely to produce samples that do not represent the
Population.
III. Bias is usually reduced when sample size is larger.
(Multiple Choice)
4.9/5 (35)
Over the trial month the market share in the sample rose to 22% of shoppers. The
company's board of directors decided this increase was significant. Now that they have
concluded the new marketing campaign works, why might they still choose not to invest in
the campaign?
(Essay)
4.9/5 (36)
Here is the corresponding regression table: Dependent variable is: JanTemp
R squared R squared (adjusted)
with degrees of freedom
Source Sum of Squares df Mean Square F-ratio Regression 7061.32 1 7061.32 135 Residual 2764.21 53 52.1549 Variable Coefficient SE(Coeff) t-ratio P-value Intercept 108.805 7.146 15.2 \leq0.0001 Lat -2.11114 0.1814 -11.6 \leq0.0001
Write a brief report based on this regression. Explain in words and numbers what this
equation says about the relationship between average January low temperature and
latitude. Discuss the R2 value and t-ratios.
(Essay)
4.8/5 (29)
If the diameter is increased from 4 inches to 14 inches, the predicted number of cheerios will
Increase by about…
(Multiple Choice)
4.8/5 (35)
Based on the data they collected during the trial program, management found that a 95%
confidence interval for the percentage of defective chips was (5.0%, 7.0%). What conclusion
should management reach about the new incentive program? Explain.
(Essay)
4.8/5 (40)
Moods A headline in the New York Times announced "Research shows running can alter
one's moods". The article reported that researchers gave a Personality Assessment Test to
231 males who run at least 20 miles a week, and found "statistically significant personality
differences between the runners and the male population as a whole." Do you think the
headline was appropriate? Explain.
(Essay)
4.8/5 (30)
Studying Assume that 75% of the Stats students studied for this test. If 40% of those who
study get an A, but only 10% of those who don't study get an A, what is the probability that
someone who gets an A actually studied for the test?
(Essay)
4.8/5 (42)
Based on data that she collected during the trial period the store's owner found that a 98%
confidence interval for the proportion of all shoppers who might buy something was (27%,
35%). What conclusion should she reach about the mannequins? Explain.
(Essay)
4.9/5 (36)
What is the probability that a student from this class eats breakfast or flosses?
(Multiple Choice)
4.9/5 (34)
Design an experiment to determine if the home teams have an unfair advantage when
shooting free-throws.
(Essay)
4.7/5 (42)
Filters
- Essay(0)
- Multiple Choice(0)
- Short Answer(0)
- True False(0)
- Matching(0)