Exam 8: Regression, Associations, and Predictive Modeling
Exam 1: Exploring and Understanding Data125 Questions
Exam 2: Exploring Relationships Between Variables165 Questions
Exam 3: Gathering Data111 Questions
Exam 4: Randomness and Probability148 Questions
Exam 5: From the Data at Hand to the World at Large128 Questions
Exam 6: Accessing Associations Between Variables93 Questions
Exam 7: Inference When Variables Are Related25 Questions
Exam 8: Regression, Associations, and Predictive Modeling792 Questions
Select questions type
Auto insurance The Insurance Institute for Highway Safety publishes ratings for all
models of vehicles to compare the relative risk of payouts. 100 is the mean rating for all
vehicles. A rating of 122 means the vehicle is 22% worse than average. The table at the
right shows the summary statistics for the collision ratings of 27 midsize cars. Min 57 Q1 99 Median 109 Q3 122 Max 173 Mean 110.9 SD 23.99
a. Were any of the ratings outliers? Show how you made your decision.
b. A histogram of the data is shown. Is it more appropriate to use the mean and standard
deviation, or the median and IQR to describe these data? Explain. 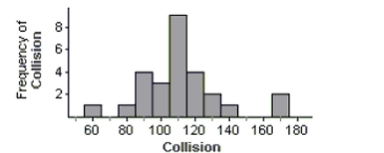
(Essay)
4.9/5  (40)
(40)
SHORT ANSWER. Write the word or phrase that best completes each statement or answers the question.
Of the 23 first year male students at State U. admitted from Jim Thorpe High School, 8 were offered baseball scholarships and
7 were offered football scholarships. The University admissions committee looked at the students' composite ACT scores
(shown in the tabl, wondering if the University was lowering their standards for athletes. Assuming that this group of
students is representative of all admitted students, what do you think? 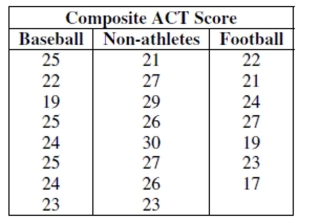 -Test an appropriate hypothesis and state your conclusion.
(Essay)
5.0/5 (36)
What is the probability that the true proportion of the professor's students who were
registered to vote is in your confidence interval?
(Essay)
4.9/5 (26)
Explain clearly whether this data should be analyzed using a 2-sample t test approach or a
match pairs t-test method.
(Essay)
4.8/5 (29)
College students' spending A consumer group wants to see if a new education program
will improve the spending habits of college students. Students in an economics class are
randomly assigned to three different courses on spending habits.
a. What are the experimental units?
b. How many factors are there?
c. How many treatments are there?
d. What is the response variable?
(Essay)
4.9/5 (36)
Do the data indicate that anxiety levels about Statistics decreases after students take
Statistics? Test an appropriate hypothesis and state your conclusion.
(Essay)
4.9/5 (41)
Someone suggested that Max arrange the tanks so that six with the lowest temperature are
on one end of the room, and the six with the highest temperature are at the other end of the
room. Explain how this could introduce confounding into the experiment.
(Essay)
4.9/5 (31)
Housing costs A government report on housing costs says that single-family home prices
nationwide are skewed to the right, with a mean of $235,700. We want to see how home
prices in Orange County, California compare with those nationwide.
a. We collect price data from a random sample of 50 homes in Orange County, California.
Why is it okay to use these data for inference even though the population is skewed?
b. The standard deviation of the 50 homes in our sample was $25,500. Specify the sampling
model for the mean price of such samples.
c. This sample of randomly chosen homes produced a 90% confidence interval for the
mean price in Orange County of ($233954, $246046). Does this interval provide evidence
that single-family home prices are unusually high in this county? Explain briefly.
d. Suppose we want to collect a new sample. How many homes must we survey to have
90% confidence of estimating the mean local price to within $2000?
(Essay)
5.0/5 (43)
A least squares line of regression has been fitted to a scatterplot; the model's residuals plot is
Shown.
Which is true? 
(Multiple Choice)
4.9/5 (38)
If the teacher in simply surveyed all of her students, what kind of sampling would that be? 14)
Explain why this method is biased. Be sure to name the kind(s) of bias you describe and
link it to the variable of interest.
(Essay)
4.9/5 (45)
What are the chances that if the monkeys jump every day for a week that at least one will
fall off of the bed?
(Essay)
4.7/5 (41)
Do you think social media use is independent of age? Give statistical evidence to support
your conclusion.
(Essay)
4.8/5 (44)
We might choose to display data with a stemplot rather than a boxplot because a stemplot
I. reveals the shape of the distribution.
II. is better for large data sets.
III. displays the actual data.
(Multiple Choice)
4.9/5 (40)
The mean number of hours worked for the 30 males was 6, and for the 20 females was 9. The
Overall mean number of hours worked …
(Multiple Choice)
4.7/5 (32)
A professor has kept records on grades that students have earned in his class. If he wants to
Examine the percentage of students earning the grades A, B, C, D, and F during the most recent
Term, which kind of plot could he make?
(Multiple Choice)
4.8/5 (42)
A supermarket claims that their checkout scanners correctly price 99.8% of the items sold. How
Many items would you expect to buy, on average, to find one that scans incorrectly?
(Multiple Choice)
4.8/5 (40)
What is the correlation coefficient for this relationship? Interpret this result in context.
(Essay)
4.9/5 (39)
Seatbelts Safety officials hope a public information campaign will increase the use of
seatbelts above the current 70% level. Their efforts include running radio and TV ads,
putting up billboards, having police officers appear on talk shows, and getting newspapers
to indicate whether people injured in accidents were belted in. After several months they
check the effectiveness of this campaign with a statewide survey of 560 randomly chosen
drivers. 407 of those drivers report that they wear a seatbelt.
a. Verify that a Normal model is a good approximation for the binomial model in this
situation.
b. Does the survey result suggest that the education/advertising campaign was effective?
Explain.
(Essay)
4.8/5 (38)
Flight costs Every year Educational Services (ETS) selects readers for the Advanced
Placement Exams. Recently the AP Statistics exam has been graded in Lincoln, Nebraska.
One objective of ETS is to achieve equity in grading by inviting teachers to be readers from
all parts of the nation. However budgets are a consideration also. The accountants at ETS
wonder if the flights from cities west of Lincoln are the same as flight costs from cities east
of Lincoln. A random sample of the expense vouchers from last year was reviewed for the
cost of airline tickets. Costs (in dollars) are shown in the table. East West 265 257 298 320 340 295 219 288 199 366 398 275 359 430 309 397 105 253 253 366
Indicate what inference procedure you would use to see if there is a significant difference
in the costs of airline flights between the west and east coasts to Lincoln, Nebraska, then
decide if it is okay to actually perform that inference procedure. (Check the appropriate
assumptions and conditions and indicate whether you could or could not proceed. You do
not have to do the actual test.)
(Essay)
4.8/5 (38)
Filters
- Essay(0)
- Multiple Choice(0)
- Short Answer(0)
- True False(0)
- Matching(0)