Exam 8: Regression, Associations, and Predictive Modeling
Exam 1: Exploring and Understanding Data125 Questions
Exam 2: Exploring Relationships Between Variables165 Questions
Exam 3: Gathering Data111 Questions
Exam 4: Randomness and Probability148 Questions
Exam 5: From the Data at Hand to the World at Large128 Questions
Exam 6: Accessing Associations Between Variables93 Questions
Exam 7: Inference When Variables Are Related25 Questions
Exam 8: Regression, Associations, and Predictive Modeling792 Questions
Select questions type
If the point in the upper right corner of this scatterplot is removed from the data set, then what will
Happen to the slope of the line of best fit (b) and to the correlation (r)? 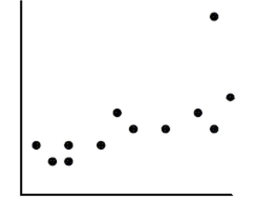
(Multiple Choice)
5.0/5  (34)
(34)
Suppose we collect data hoping to be able to estimate the prices of commonly owned new cars (in
$) from their lengths (in feet). Of these possibilities, the slope of the line of best fit is most likely to
Be
(Multiple Choice)
4.8/5 (43)
If a data set has a relationship that is best described by a linear model, than the residual plot will
(Multiple Choice)
4.8/5 (31)
Make a scatterplot and describe the association between the size of the diamond (carat) and
the cost (in US dollars).
(Essay)
4.9/5 (32)
Which statement about influential points is true?
I. Removal of an influential point changes the regression line.
II. Data points that are outliers in the horizontal direction are more likely to be influential than
Points that are outliers in the vertical direction.
III. Influential points have large residuals.
(Multiple Choice)
4.8/5 (35)
If the workers are paid $10/hour, what is the expected long-term cost of a 1-hour shift?
(Multiple Choice)
4.9/5 (40)
Find a 95% confidence interval for the true proportion of the professor's students who were
registered to vote. (Make sure to check any necessary conditions and to state a conclusion
in the context of the problem.)
(Essay)
4.7/5 (33)
The owner of a car dealership planned to develop strategies to increase sales. He hoped to learn the
Reasons why many people who visit his car lot do not eventually buy a car from him. For one
Month he asked his sales staff to keep a list of the names and addresses of everyone who came in to
Test drive a car. At the end of the month he sent surveys to the people who did not buy the car,
Asking them why. About one third of them returned the survey, with 44% of those indicating that
They found a lower price elsewhere. Which is true?
I. The population of interest is all potential car buyers.
II. This survey design suffered from non-response bias.
III. Because it comes from a sample 44% is a parameter, not a statistic.
(Multiple Choice)
4.8/5 (36)
What is the probability that a customer gets more than a 20% discount?
(Essay)
4.8/5 (35)
A biology professor reports that historically grades in her introductory biology course have
been distributed as follows: 15% A's, 30% B's, 40% C's, 10% D's, and 5% F's. Grades in her
most recent course were distributed as follows: Grade A B C D F Frequency 89 121 78 25 12
a. Test an appropriate hypothesis to decide if the professor's most recent grade distribution
matches the historical distribution. Give statistical evidence to support your conclusion.
b. Which grade impacted your decision the most? Explain what this means in the context of
the problem.
(Essay)
4.9/5 (34)
Breaking strength A company manufactures polypropylene rope in six different sizes. To
assess the strength of the ropes they test two samples of each size to see how much force
(in kilograms) the ropes will hold without breaking. The table shows the results of the tests.
We want to create a model for predicting the breaking strength from the diameter of the
rope.
a. Find a model that uses re-expressed data to straighten the scatterplot.
b. The company is thinking of introducing a new 25mm rope. How strong should it be?
(Write a sentence in context based on one of your models.)
(Essay)
4.9/5 (28)
If the company charges $25 for this extended warranty, what is the expected value of the
profit they will earn?
(Essay)
4.7/5 (44)
If the professor only knew the information from the September 2004 Gallup poll and
wanted to estimate the percentage of her students who were registered to vote to within
idence, how many students should she sample?
(Essay)
4.9/5 (36)
What are the chances that the kangaroos can jump two nights in a row with no one falling
off the bed?
(Essay)
4.7/5 (33)
Maple trees A forester would like to know how big a maple tree might be at age 50 years.
She gathers data from some trees that have been cut down, and plots the diameters (in
inches) of the trees against their ages (in years). First she makes a linear model. The
scatterplot and residuals plot are shown. 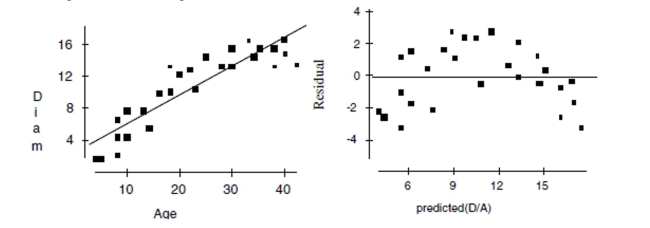 a. Describe the association shown in the scatterplot.
b. Do you think the linear model is appropriate? Explain.
c. If she uses this model to try to predict the diameter of a 50-year old maple tree, would
you expect that estimate to be fairly accurate, too low, or too high? Explain.
Now she re-expresses the data, using the logarithm of age to try to predict the diameter of
the tree. Here are the regression analysis and the residuals plot. Dependent variable is: Diam R squared =84.3\% Variable Coefficient s.e. of Coeff Constant -8.60770 1.681 Log(Age) 15.0701 1.299
a. Describe the association shown in the scatterplot.
b. Do you think the linear model is appropriate? Explain.
c. If she uses this model to try to predict the diameter of a 50-year old maple tree, would
you expect that estimate to be fairly accurate, too low, or too high? Explain.
Now she re-expresses the data, using the logarithm of age to try to predict the diameter of
the tree. Here are the regression analysis and the residuals plot. Dependent variable is: Diam R squared =84.3\% Variable Coefficient s.e. of Coeff Constant -8.60770 1.681 Log(Age) 15.0701 1.299
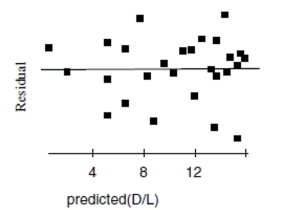 d. Explain why you think this is a better model.
e. Using this model, predict the diameter of a maple tree at age 50 years.
d. Explain why you think this is a better model.
e. Using this model, predict the diameter of a maple tree at age 50 years.
(Essay)
4.9/5 (40)
Five juniors and four seniors have applied for two open student council positions. School
Administrators have decided to pick the two new members randomly. What is the probability they
Are both juniors or both seniors?
(Multiple Choice)
4.8/5 (38)
A manufacturing firm orders computer chips from three different companies: 10% from
Company A; 20% from Company B; and 70% from Company C. Some of the computer
chips that are ordered are defective: 4% of chips from Company A are defective; 2% of
chips from Company B are defective; and 0.5% of chips from Company C are defective. A
worker at the manufacturing firm discovers that a randomly selected computer chip is
defective. What is the probability that the computer chip came from Company B? Show
your work.
(Essay)
4.9/5 (42)
Write the regression equation. Define all variables used in your equation.
(Essay)
4.9/5 (37)
Grades You believe that there is a 20% chance that you will earn an A in your English
class, a 10% chance that you will earn an A in your Physics class, and a 5% chance that you
will earn an A in both classes.
a. Find the probability that you do not get an A in either English or Physics.
b. Are "earning an A in English" and "earning an A in Physics" disjoint events? Explain.
c. Are "earning an A in English" and "earning an A in Physics" independent events?
Explain.
(Essay)
4.8/5 (39)
Filters
- Essay(0)
- Multiple Choice(0)
- Short Answer(0)
- True False(0)
- Matching(0)