Exam 8: Regression, Associations, and Predictive Modeling
Exam 1: Exploring and Understanding Data125 Questions
Exam 2: Exploring Relationships Between Variables165 Questions
Exam 3: Gathering Data111 Questions
Exam 4: Randomness and Probability148 Questions
Exam 5: From the Data at Hand to the World at Large128 Questions
Exam 6: Accessing Associations Between Variables93 Questions
Exam 7: Inference When Variables Are Related25 Questions
Exam 8: Regression, Associations, and Predictive Modeling792 Questions
Select questions type
One manager suggesting just going to the stores in the city where the company is
headquartered so they wouldn't have to travel far. What type of sampling would this be?
Explain why this method is biased. Be sure to name the kind(s) of bias you describe and
link it to the variable of interest.
(Essay)
4.8/5  (34)
(34)
Telephone poll The City Council decides to conduct a telephone poll. Pollsters ask a
carefully chosen random sample of adults this question: "Do you favor the construction of a
new prison to deal with the high level of violent crime in our State?" In what way might the
proportion of "Yes" answers fail to accurately reflect true public opinion? Explain briefly.
What kind of bias is this?
(Essay)
4.7/5 (40)
For more accurate cost determination, the insurance companies want to estimate the life
expectancy to within one year with 95% confidence. How many randomly selected records
would they need to have?
(Essay)
4.7/5 (31)
On the axes below, sketch a scatterplot described:
a. a strong negative association  b. a strong association but r is near 0
  c. a weak but positive association
(Essay)
4.9/5 (41)
15. Baldness and heart attacks A recent medical study observed a higher frequency of
heart attacks among a group of bald men than among another group of men who were not
bald. Based on a P-value of 0.062 the researchers concluded there was some evidence that
male baldness may be a risk factor for predicting heart attacks. Explain in this context what
their P-value means.
(Essay)
4.8/5 (44)
The yearly service contract for the food fryer estimates a mean annual cost of $140 with a
standard deviation of $40. What is the expected value and standard deviation of the total
cost for the service contracts for the freezer and the food fryer?
(Essay)
4.8/5 (39)
If the point in the upper left corner of the scatterplot is removed, what will happen to the
Correlation (r) and the slope of the line of best fit (b)? 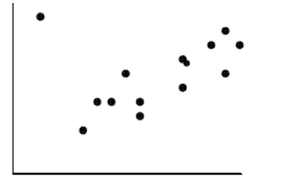
(Multiple Choice)
4.8/5 (36)
What are the chances that he as he removes marbles from the bag, he doesn't get an orange
marble until his fourth attempt?
(Essay)
4.7/5 (42)
This regression analysis examines the relationship between the number of years of formal
Education a person has and their annual income. According to this model, about how much more
Money do people who finish a 4-year college program earn each year, on average, than those with
Only a 2-year degree? Dependent variable is Income
R-squared
with 57 degrees of freedom
Variable Coefficient s.e. of Coeff Constant 3984.45 6600 Education 2668.45 600.1
(Multiple Choice)
4.7/5 (38)
The Masterfoods company manufactures bags of Peanut Butter M&M's. They report that
they make 10% each brown and red candies, and 20% each yellow, blue, and orange
candies. The rest of the candies are green.
a. If you pick a Peanut Butter M&M at random, what is the probability that
i. it is green?
ii. it is a primary color (red, yellow, or blue)?
iii. it is not orange?
b. If you pick four M&M's in a row, what is the probability that
i. they are all blue?
ii. none are green?
iii. at least one is red?
iv. the fourth one is the first one that is brown?
c. After picking 10 M&M's in a row, you still have not picked a red one. A friend says that
you should have a better chance of getting a red candy on your next pick since you have
yet to see one. Comment on your friend's statement.
(Essay)
4.9/5 (38)
What are the chances that a monkey and a kangaroo will fall off the bed?
(Essay)
4.8/5 (41)
Smoking State public health officials claim that 18% of adults currently smoke cigarettes.
a. We start selecting a few adults at random, asking each if he or she is a smoker. Explain
why these can be considered Bernoulli trials.
b. How many people do you expect to have to ask in order to find a smoker?
c. Let X represent the number of smokers among a randomly chosen sample of 30 adults.
What is the probability model for X? Name the model (including its parameters) and
specify the mean and standard deviation of X.
d. What is the probability that there are at least 8 smokers among our sample of 30 people?
(Essay)
4.9/5 (41)
A common objective for many school administrators is to increase the number of students
taking SAT and ACT tests from their school. The data from each state from 2003 are
reflected in the scatterplot.  a. Write a few sentences describing the association.
b. Estimate the correlation. ________
c. If the point in the top left corner (4, 1215) were removed, would the correlation become
stronger, weaker, or remain about the same? Explain briefly.
d. If the point in the very middle (38, 1049) were removed, would the correlation become
stronger, weaker, or remain about the same? Explain briefly.
a. Write a few sentences describing the association.
b. Estimate the correlation. ________
c. If the point in the top left corner (4, 1215) were removed, would the correlation become
stronger, weaker, or remain about the same? Explain briefly.
d. If the point in the very middle (38, 1049) were removed, would the correlation become
stronger, weaker, or remain about the same? Explain briefly.
(Essay)
4.9/5 (44)
For families who live in apartments the correlation between the family's income and the amount of
Rent they pay is r = 0.60. Which is true?
I. In general, families with higher incomes pay more in rent.
II. On average, families spend 60% of their income on rent.
III. The regression line passes through 60% of the (income$, rent$) data points.
(Multiple Choice)
4.9/5 (39)
Carbon dating QuarkNet, a project funded by the National Science Foundation and the
U.S. Department of Energy, poses the following problem on its website:
"Last year, deep within the Soudan mine, QuarkNet teachers began a long-term
experiment to measure the amount of carbon-14 remaining in an initial 100-gram sample
at 2000-year intervals. The experiment will be complete in the year 32001. Fortunately, a
method for sending information backwards in time will be discovered in the year 29998,
so, although the experiment is far from over, the results are in."
Here is a portion of the data: Time (yr) 0 2000 4000 6000 8000 10,000 12,000 14,000 16,000 18,000 Mass (g) 100 76 61 47 36 29 22 17 13 10
A scatterplot of these data looks like: 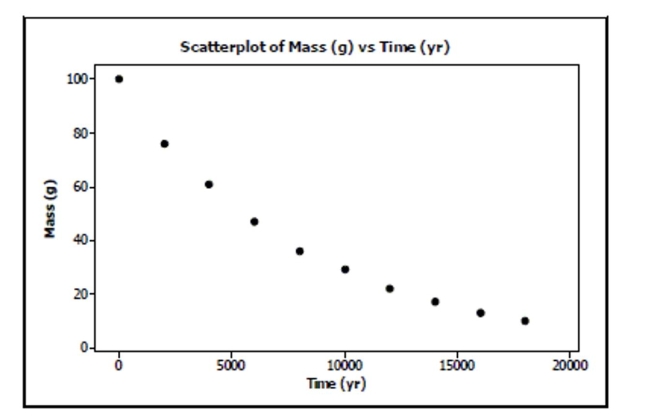 a. Straighten the scatterplot by re-expressing these data and create an appropriate model
for predicting the mass from the year.
b. Use your model to estimate what the mass will be after 7500 years.
c. Can you use your model to predict when 50 g of the sample will be left? Explain.
a. Straighten the scatterplot by re-expressing these data and create an appropriate model
for predicting the mass from the year.
b. Use your model to estimate what the mass will be after 7500 years.
c. Can you use your model to predict when 50 g of the sample will be left? Explain.
(Essay)
4.9/5 (45)
Subaru costs Data collected from internet ads for 1999 Subarus were used to create a model to estimate the asking price of the car based on the number of miles it had been driven. The model has and equation Price Miles . The plot of residuals versus the predicted price is shown.
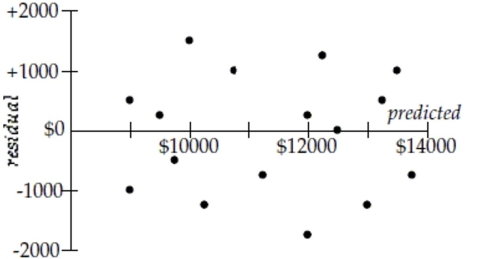 a. Do you think you could make accurate estimates of Subaru prices with this model?
Explain.
b. Interpret the slope of the line.
c. One of the cars in the data set had been driven 42,000 miles. How much was the owner
asking for it? (Show work.)
a. Do you think you could make accurate estimates of Subaru prices with this model?
Explain.
b. Interpret the slope of the line.
c. One of the cars in the data set had been driven 42,000 miles. How much was the owner
asking for it? (Show work.)
(Essay)
4.8/5 (29)
Identify the variables and tell whether each is categorical or quantitative.
(Essay)
4.7/5 (34)
Name and describe the kind of bias that might be present if the management decides that
instead of subjecting people to random testing they'll just…
a. Hold department meetings and drug test the employees that attend.
b. Offer additional employee discounts for those employees who agree to be drug tested.
(Essay)
4.8/5 (30)
Filters
- Essay(0)
- Multiple Choice(0)
- Short Answer(0)
- True False(0)
- Matching(0)