Exam 8: Regression, Associations, and Predictive Modeling
Exam 1: Exploring and Understanding Data125 Questions
Exam 2: Exploring Relationships Between Variables165 Questions
Exam 3: Gathering Data111 Questions
Exam 4: Randomness and Probability148 Questions
Exam 5: From the Data at Hand to the World at Large128 Questions
Exam 6: Accessing Associations Between Variables93 Questions
Exam 7: Inference When Variables Are Related25 Questions
Exam 8: Regression, Associations, and Predictive Modeling792 Questions
Select questions type
Suppose that a device advertised to increase a car's gas mileage really does not work. We test it on a small fleet of cars (with : not effective), and our data results in a -value of . What probably happens as a result of our experiment?
(Multiple Choice)
4.8/5  (36)
(36)
In this context describe a Type II error and the impact such an error would have on this
group's efforts.
(Essay)
4.8/5 (38)
Although most of us buy milk by the quart or gallon, farmers measure daily production in
pounds. Guernsey cows average 39 pounds of milk a day with a standard deviation of 8
pounds. For Jerseys the mean daily production is 43 pounds with a standard deviation of 5
pounds. When being shown at a state fair a champion Guernsey and a champion Jersey
each gave 54 pounds of milk. Which cow's milk production was more remarkable?
Explain.
(Essay)
4.8/5 (40)
Test identification Suppose you were asked to analyze each of the situations described below.
(NOTE: Do not do these problems!) For each, indicate which procedure you would use (pick the appropriate number from the list), the test statistic ( , , or "chi-squared"), and, if or , the number of degrees of freedom. A choice may be used more than once.
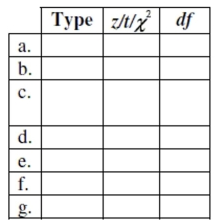 1. proportion sample
2. difference of proportions samples
3. mean - 1 sample
4. difference of means - independent samples
5. mean of differences - matched pairs
6. goodness of fit
7. homogeneity
8. independence
a. Which takes less time to travel to work-car or train? We select a random sample of 45
businessmen, observe them commuting using both methods, and compare their travel
times.
b. A college professor wonders if two versions (A and
B) of his exam are equally difficult.
He randomly mixes 20 Version A's and 20 Version B's together and passes them out to his
40 students. After grading the exams, he compares the scores for the two versions.
c. Forty people complaining of allergies take an antihistamine. They report that their
discomfort subsided in an average of 18 minutes; the standard deviation was 4 minutes.
The manufacturer wants a 95% confidence interval for the "relief time".
d. A health professional selected a random sample of 100 patients from each of four major
hospital emergency rooms to see if the major reasons for emergency room visits are similar
in all four major hospitals. The major reason categories are accident, illegal activity, illness,
or other.
e. A policeman believes that about 40% of older drivers speed on highways, but a
confidential survey found that 49 of 88 randomly selected older drivers admitted speeding
on highways at least once. Is this strong evidence that the policeman was wrong?
f. According to United Nations Population Division, the age distribution of the
Commonwealth of Australia is: 21% less than 15 years of age, 67% between 15 and 65 years
of age, and 12% are over 65 years old. A random sample of 210 residents of Canberra
revealed 40 were less than 15 years of age, 145 were between 15 and 65 years of age, and 25
were over 65 years old. Is Canberra unusual in any way?
g. Among a random sample of college-age students, 6% of the 473 men said they had been
adopted, compared to only 4% of the 552 women. Does this indicate a significant difference
between adoption rates of males and females in college-age students?
1. proportion sample
2. difference of proportions samples
3. mean - 1 sample
4. difference of means - independent samples
5. mean of differences - matched pairs
6. goodness of fit
7. homogeneity
8. independence
a. Which takes less time to travel to work-car or train? We select a random sample of 45
businessmen, observe them commuting using both methods, and compare their travel
times.
b. A college professor wonders if two versions (A and
B) of his exam are equally difficult.
He randomly mixes 20 Version A's and 20 Version B's together and passes them out to his
40 students. After grading the exams, he compares the scores for the two versions.
c. Forty people complaining of allergies take an antihistamine. They report that their
discomfort subsided in an average of 18 minutes; the standard deviation was 4 minutes.
The manufacturer wants a 95% confidence interval for the "relief time".
d. A health professional selected a random sample of 100 patients from each of four major
hospital emergency rooms to see if the major reasons for emergency room visits are similar
in all four major hospitals. The major reason categories are accident, illegal activity, illness,
or other.
e. A policeman believes that about 40% of older drivers speed on highways, but a
confidential survey found that 49 of 88 randomly selected older drivers admitted speeding
on highways at least once. Is this strong evidence that the policeman was wrong?
f. According to United Nations Population Division, the age distribution of the
Commonwealth of Australia is: 21% less than 15 years of age, 67% between 15 and 65 years
of age, and 12% are over 65 years old. A random sample of 210 residents of Canberra
revealed 40 were less than 15 years of age, 145 were between 15 and 65 years of age, and 25
were over 65 years old. Is Canberra unusual in any way?
g. Among a random sample of college-age students, 6% of the 473 men said they had been
adopted, compared to only 4% of the 552 women. Does this indicate a significant difference
between adoption rates of males and females in college-age students?
(Essay)
4.9/5 (37)
Great Britain has a great literary tradition that spans centuries. One might assume, then, that Britons read more than citizens
of other countries. Some Canadians, however, feel that a higher percentage of Canadians than Britons read. A recent Gallup
Poll reported that 86% of 1004 randomly sampled Canadians read at least one book in the past year, compared to 81% of 1009
randomly sampled Britons. Do these results confirm a higher reading rate in Canada?
-Test an appropriate hypothesis and state your conclusions.
(Essay)
4.9/5 (41)
House calls A local plumber makes house calls. She charges $30 to come out to the house
and $40 per hour for her services. For example, a 4-hour service call costs $30 + $40(4) =
$190.
a. The table shows summary statistics for the past month. Fill in the table to find out the
cost of the service calls. Statistic Hours of Service Call Cost of Service Call Mean 4.5 Median 3.5 SD 1.2 IQR 2.0 Minimum 0.5
b. This past month, the time the plumber spent on one service call corresponded to a
z-score of - 1.50. What was the z-score for the cost of that service call?
(Essay)
4.7/5 (39)
A regression analysis of students' college grade point averages (GPAs) and their high school GPAs
Found R2 = 0.311. Which of these is true?
I. High school GPA accounts for 31.1% of college GPA.
II. 31.1% of college GPAs can be correctly predicted with this model.
III. 31.1% of the variance in college GPA can be accounted for by the model
(Multiple Choice)
4.9/5 (41)
Find the expected number of repairs this kind of freezer is expected to need each year.
Show your work.
(Essay)
4.7/5 (40)
We can use the length of a man's hand span to predict his height, with a correlation coefficient of . If change our measurements from to , the new correlation will be
(Multiple Choice)
4.8/5 (40)
SAT prep Surveys indicate that 5% of the students who took the SATs had enrolled in an
SAT prep course. 30% of the SAT prep students were admitted to their first choice college,
as were 20% of the other students. You overhear a classmate say he got into the college he
wanted. What is the probability he didn't take an SAT prep course?
(Essay)
4.8/5 (42)
After conducting a survey at a pet store to see what impact having a pet had on the
condition of the yard, a news reporter stated "There appears to be a strong correlation
between the owning a pet and the condition of the yard." Comment on this observation.
(Essay)
4.7/5 (45)
Now, consider longitude. Should the longitude of a city have an influence on average
January low temperature? Here is the regression: Dependent variable is: JanTemp
squared squared (adjusted)
with degrees of freedom
Source Sum of Squares df Mean Square F-ratio Regression 8.34647 1 8.34647 0.045 Residual 9817.18 53 185.230 Variable Coefficient SE(Coeff) t-ratio P-value Intercept 24.0487 11.40 2.11 0.0396 Long 0.026186 0.1234 0.212 0.8327
Test the null hypothesis that the true coefficient of Long is zero in this regression. State the
null and alternative hypotheses and indicate your procedure and conclusion.
(Essay)
4.8/5 (31)
Which of the following is not required in an experimental design?
(Multiple Choice)
4.9/5 (35)
Penicillin Doctors studying how the human body assimilates medication inject some
patients with penicillin, and then monitor the concentration of the drug (in units/cc) in the
patients' blood for seven hours. The data are shown in the scatterplot. First they tried to fit
a linear model. The regression analysis and residuals plot are shown. Dependent variable is:
Concentration
No Selector
R squared R squared (adjusted)
with degrees of freedom
Source Sum of Squares df Mean Square F-ratio Regression 4900.55 1 4900.55 407 Residual 494.199 41 12.0536
Variable Coefficient s.e. of Coeff t-ratio prob Constant 40.3266 1.295 31.1 \leq0.0001 Time -5.95956 0.2956 -20.2 \leq0.0001
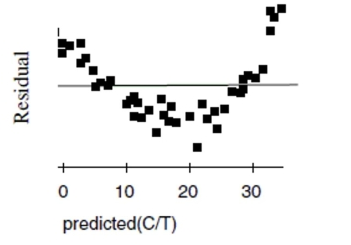 a. Find the correlation between time and concentration.
b. Using this model, estimate what the concentration of penicillin will be after 4 hours.
c. Is that estimate likely to be accurate, too low, or too high? Explain.
Now the researchers try a new model, using the re-expression log(Concentration). Examine
the regression analysis and the residuals plot below. Dependent variable is: LogCnn No Selector R squared R squared (adjusted)
with degrees of freedom
Source Sum of Squares df Mean Square F-ratio Regression 4.11395 1 4.11395 2022 Residual 0.083412 41 0.002034
Variable Coefficient s.e. of Coeff t-ratio prob Constant 1.80184 0.0168 107 \leq0.0001 Time -0.172672 0.0038 -45.0 \leq0.0001
a. Find the correlation between time and concentration.
b. Using this model, estimate what the concentration of penicillin will be after 4 hours.
c. Is that estimate likely to be accurate, too low, or too high? Explain.
Now the researchers try a new model, using the re-expression log(Concentration). Examine
the regression analysis and the residuals plot below. Dependent variable is: LogCnn No Selector R squared R squared (adjusted)
with degrees of freedom
Source Sum of Squares df Mean Square F-ratio Regression 4.11395 1 4.11395 2022 Residual 0.083412 41 0.002034
Variable Coefficient s.e. of Coeff t-ratio prob Constant 1.80184 0.0168 107 \leq0.0001 Time -0.172672 0.0038 -45.0 \leq0.0001
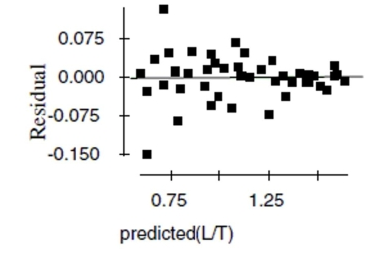 d. Explain why you think this model is better than the original linear model.
e. Using this new model, estimate the concentration of penicillin after 4 hours.
d. Explain why you think this model is better than the original linear model.
e. Using this new model, estimate the concentration of penicillin after 4 hours.
(Essay)
4.8/5 (32)
Light bulbs are measured in lumens (light output), watts (energy used), and hours (life). A
standard white light bulb has a mean life of 675 hours and a standard deviation of 50
hours. A soft white light bulb has a mean life of 700 hours and a standard deviation of 35
hours. At a local science competition, both light bulbs lasted 750 hours. Which light bulb's
life span was better? Explain.
(Essay)
4.8/5 (30)
Political math A recent study by Yale professors found that people's ability to do
mathematics computations got worse when the result went against the person's political
ideology. This was based on a randomized experiment in which people were given the
same basic computation, but some were given the question in a politically neutral context
and others were given the same computation in a context in which the correct answer went
against their political ideology. The difference between the proportion of people who got
the question wrong in a 'neutral' context and those who got the question wrong in a
'political' context was reported to be "statistically significant."
a. Briefly explain what "statistically significant" means in this context.
b. Would it be appropriate for the news media to report that the political context caused the
poor computational results? Explain.
(Essay)
4.9/5 (37)
Exercising Owners of an exercise gym believe that a Normal model is useful in projecting
the number of clients who will exercise in their gym each week. They use a mean of 800
clients and a standard deviation of 90 clients.
a. Draw and clearly label this model. ![Exercising Owners of an exercise gym believe that a Normal model is useful in projecting the number of clients who will exercise in their gym each week. They use a mean of 800 clients and a standard deviation of 90 clients. a. Draw and clearly label this model. b. What is the first quartile of the weekly number of clients? [Show work] c. An owner of another gym reports that 5% of the time their gym has fewer than 450 clients, and 40% of the time the gym has more than 1085 clients. What parameters should that owner use for his Normal model?](https://storage.examlex.com/TB3452/11eb44f6_4f95_4c60_84a5_915610c76731_TB3452_00.jpg) b. What is the first quartile of the weekly number of clients? [Show work]
c. An owner of another gym reports that 5% of the time their gym has fewer than 450
clients, and 40% of the time the gym has more than 1085 clients. What parameters should
that owner use for his Normal model?
b. What is the first quartile of the weekly number of clients? [Show work]
c. An owner of another gym reports that 5% of the time their gym has fewer than 450
clients, and 40% of the time the gym has more than 1085 clients. What parameters should
that owner use for his Normal model?
(Essay)
4.9/5 (41)
Filters
- Essay(0)
- Multiple Choice(0)
- Short Answer(0)
- True False(0)
- Matching(0)