Exam 8: Regression, Associations, and Predictive Modeling
Exam 1: Exploring and Understanding Data125 Questions
Exam 2: Exploring Relationships Between Variables165 Questions
Exam 3: Gathering Data111 Questions
Exam 4: Randomness and Probability148 Questions
Exam 5: From the Data at Hand to the World at Large128 Questions
Exam 6: Accessing Associations Between Variables93 Questions
Exam 7: Inference When Variables Are Related25 Questions
Exam 8: Regression, Associations, and Predictive Modeling792 Questions
Select questions type
Which type of plot would be most appropriate to display the responses to type of residence?
(Multiple Choice)
4.8/5  (29)
(29)
At www.census.gov you can create a "population pyramid" for any country. These
pyramids are back-to-back histograms. This pyramid shows Mexico's 2000 female
population and the census bureau's projection for 2050. Write a few sentences
summarizing the changes that are forecast. 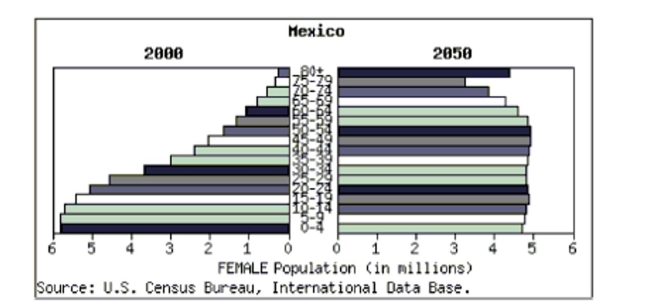
(Essay)
4.8/5 (27)
Adult female Dalmatians weigh an average of 50 pounds with a standard deviation of 3.3
pounds. Adult female Boxers weigh an average of 57.5 pounds with a standard deviation
of 1.7 pounds. One statistics teacher owns an underweight Dalmatian and an underweight
Boxer. The Dalmatian weighs 45 pounds, and the Boxer weighs 52 pounds. Which dog is
more underweight? Explain.
(Essay)
5.0/5 (33)
A company's sales increase by the same amount each year. This growth is . . .
(Multiple Choice)
5.0/5 (41)
Is there evidence of an association between high school and first-year college GPAs? Test
an appropriate hypothesis and state your conclusion in the proper context.
(Essay)
4.9/5 (39)
Variables X and Y have r = 0.40. If we decrease each X value by 0.1, double each Y value, and then
Interchange them (put X on the Y-axis and vice versa) the new correlation will be
(Multiple Choice)
4.9/5 (35)
The city council has 6 men and 3 women. If we randomly choose two of them to co-chair a
Committee, what is the probability these chairpersons are the same gender?
(Multiple Choice)
4.8/5 (33)
Salary conversions You learn that your company is sending you and several other
employees to staff a new office in China. While there everyone will earn the equivalent of
their current salary, converted to Chinese currency at the rate of 8 yuans per dollar. In
addition, everyone will earn a weekly foreign living allowance of 200 yuans. For example,
since you are earning $1000 per week, your weekly salary in China will be 1000 x 8 + 200 =
8200 yuans.
a. Shown are some summary statistics describing the current salaries of this group being
sent overseas. Fill in the table to show what these statistics will be for the salaries you all
will earn while in China. Statistic In the US In China Minimum salary \ 400 Standard deviation \ 250 Median \ 750 IQR \ 300
b. Among this group of employees going to China, your US salary has a
What will your new z-score be, based on everyone's China salary?
(Essay)
4.8/5 (39)
We have calculated a 95% confidence interval and would prefer for our next confidence interval to
Have a smaller margin of error without losing any confidence. In order to do this, we can
I. change the z value to a smaller number.
II. take a larger sample.
III. take a smaller sample.
(Multiple Choice)
4.9/5 (30)
Associations For each pair of variables, indicate what association you expect: positive(+),
negative(-), curved(C), or none(N).
a. power level setting of a microwave; number of minutes it takes to boil water
b. number of days it rained in a month (during the summer); number of times you mowed
your lawn that month
c. number of hours a person has been up past a normal bedtime; number of minutes it
takes the person to do a crossword puzzle
d. number of hockey games played in Minnesota during a week; sales of suntan lotion in
Minnesota during that week
e. length of a student's hair; number of credits the student earned last year
(Essay)
4.8/5 (40)
For purposes of making budget plans for staffing, a college reviewed student's year in
school and area of study. Of the students, 22.5% are seniors, 25% are juniors, 25% are
sophomores, and the rest are freshmen. Also, 40% of the seniors major in the area of
humanities, as did 39% of the juniors, 40% of the sophomores, and 36% of the freshmen.
What is the probability that a randomly selected humanities major is a junior? Show your
work.
(Essay)
4.9/5 (44)
Soft drinks A restaurant owner wanted to improve the efficiency of his employees. One
way he tried to do this was to buy a machine that will automatically dispense 16 oz. of
soda into a glass rather than have the employee hold the button on the dispenser. The
actual amount dispensed by the machine can be represented by the model N(16.2, 0.3)
a. Draw and clearly label the model. 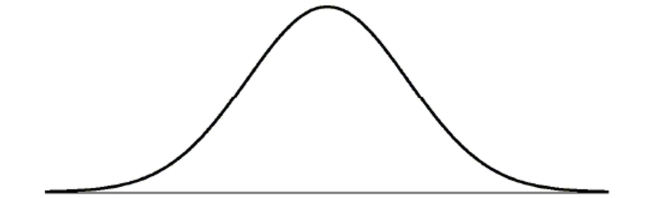 b. The sales representative who sold him the machine said, "95% of the glasses you fill
with soda will fall between _________ and _________." Fill in the blanks based on the
normal model, then comment on this claim.
c. What is the 3rd quartile of amounts dispensed?
d. If a glass will actually hold 16.7 oz. of soda, what percent of the time would you expect
the glass to overflow?
e. The manufacturer wants to reduce the overflow rate to only 1%. Assuming the mean
amount dispensed will stay the same, what standard deviation must they achieve?
f. Briefly explain what that change in standard deviation means in this context.
g. A competing manufacturer says that not only will 98% of their glasses be safe from
overflowing, but 70% will have more than 16 oz., reducing customer complaints. What
Normal model parameters is that manufacturer claiming? Show your work.
b. The sales representative who sold him the machine said, "95% of the glasses you fill
with soda will fall between _________ and _________." Fill in the blanks based on the
normal model, then comment on this claim.
c. What is the 3rd quartile of amounts dispensed?
d. If a glass will actually hold 16.7 oz. of soda, what percent of the time would you expect
the glass to overflow?
e. The manufacturer wants to reduce the overflow rate to only 1%. Assuming the mean
amount dispensed will stay the same, what standard deviation must they achieve?
f. Briefly explain what that change in standard deviation means in this context.
g. A competing manufacturer says that not only will 98% of their glasses be safe from
overflowing, but 70% will have more than 16 oz., reducing customer complaints. What
Normal model parameters is that manufacturer claiming? Show your work.
(Essay)
4.8/5 (37)
An ice cream stand reports that 12% of the cones they sell are "jumbo" size. You want to see what a
"jumbo" cone looks like, so you stand and watch the sales for a while. What is the probability that
The first jumbo cone is the fourth cone you see them sell?
(Multiple Choice)
4.9/5 (40)
Given that a randomly selected bike has a kickstand, what are the chances that it also has a water Bottle holder?
(Multiple Choice)
4.9/5 (48)
The two samples whose statistics are given in the table are thought to come from populations with
Equal variances. What is the pooled estimate of the population standard deviation? n Mean SD 12 45 6 16 41 8
(Multiple Choice)
4.9/5 (44)
Peanut M&Ms According to the Mars Candy Company, peanut M&M's are 12% brown,
15% yellow, 12% red, 23% blue, 23% orange, and 15% green. On a Saturday when you have
run out of statistics homework, you decide to test this claim. You purchase a medium bag
of peanut M&M's and find 39 browns, 44 yellows, 36 red, 78 blue, 73 orange, and 48 greens.
Test an appropriate hypothesis and state your conclusion.
(Essay)
4.8/5 (43)
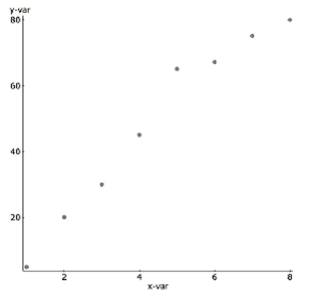
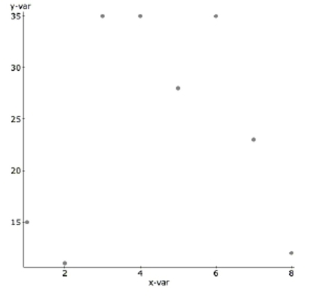
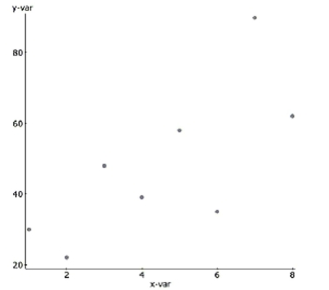
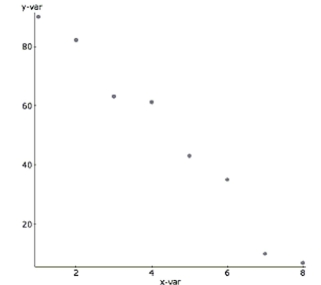
Match each graph with the appropriate correlation coefficient. ______ _____ _____- ______
A.
 B.
B.
 C.
C.
 D.
D.
(Essay)
4.8/5 (30)
A medical researcher finds that the more overweight a person is, the higher his pulse rate tends to
Be) In fact, the model suggests that 12-pound differences in weight are associated with differences
In pulse rate of 4 beats per minute. Which is true?
I. The correlation between pulse rate and weight is 0.33
II. If you lose 6 pounds, your pulse rate will slow down 2 beats per minute.
III. A positive residual means a person's pulse rate is higher than the model predicts.
(Multiple Choice)
4.7/5 (35)
Filters
- Essay(0)
- Multiple Choice(0)
- Short Answer(0)
- True False(0)
- Matching(0)