Exam 49: An Introduction to Ecology
Exam 1: Biology and the Tree of Life37 Questions
Exam 2: Water and Carbon: the Chemical Basis of Life59 Questions
Exam 3: Protein Structure and Function59 Questions
Exam 4: Nucleic Acids and the Rna World43 Questions
Exam 5: An Introduction to Carbohydrates44 Questions
Exam 53: Ecosystems and Global Ecology57 Questions
Exam 6: Lipids, Membranes, and the First Cells59 Questions
Exam 7: Inside the Cell60 Questions
Exam 8: Energy and Enzymes: an Introduction to Metabolism60 Questions
Exam 9: Cellular Respiration and Fermentation61 Questions
Exam 10: Photosynthesis58 Questions
Exam 11: Cellcell Interactions52 Questions
Exam 12: The Cell Cycle59 Questions
Exam 13: Meiosis63 Questions
Exam 14: Mendel and the Gene60 Questions
Exam 15: Dna and the Gene: Synthesis and Repair51 Questions
Exam 16: How Genes Work48 Questions
Exam 17: Transcription, Rna Processing, and Translation58 Questions
Exam 18: Control of Gene Expression in Bacteria29 Questions
Exam 19: Control of Gene Expression in Eukaryotes56 Questions
Exam 20: The Molecular Revolution: Biotechnology and Beyond70 Questions
Exam 21: Genes, Development, and Evolution38 Questions
Exam 22: Evolution by Natural Selection38 Questions
Exam 23: Evolutionary Processes37 Questions
Exam 24: Speciation56 Questions
Exam 25: Phylogenies and the History of Life63 Questions
Exam 26: Bacteria and Archaea38 Questions
Exam 27: Protists37 Questions
Exam 28: Green Algae and Land Plants59 Questions
Exam 29: Fungi47 Questions
Exam 30: An Introduction to Animals48 Questions
Exam 31: Protostome Animals54 Questions
Exam 32: Deuterostome Animals60 Questions
Exam 33: Viruses44 Questions
Exam 34: Plant Form and Function46 Questions
Exam 35: Water and Sugar Transport in Plants47 Questions
Exam 36: Plant Nutrition54 Questions
Exam 37: Plant Sensory Systems, Signals, and Responses48 Questions
Exam 38: Plant Reproduction and Development51 Questions
Exam 39: Animal Form and Function53 Questions
Exam 40: Water and Electrolyte Balance in Animals60 Questions
Exam 41: Animal Nutrition94 Questions
Exam 42: Gas Exchange and Circulation93 Questions
Exam 43: Animal Nervous Systems100 Questions
Exam 44: Animal Sensory Systems50 Questions
Exam 45: Animal Movement40 Questions
Exam 46: Chemical Signals in Animals59 Questions
Exam 47: Animal Reproduction and Development104 Questions
Exam 48: The Immune System in Animals77 Questions
Exam 49: An Introduction to Ecology40 Questions
Exam 50: Behavioral Ecology40 Questions
Exam 51: Population Ecology57 Questions
Exam 52: Community Ecology55 Questions
Exam 54: Biodiversity and Conservation Biology43 Questions
Select questions type
 -Based on the data in the figure, which of the following statements is TRUE?
Free
(Multiple Choice)
4.7/5  (42)
(42)
Correct Answer: Verified
D
For a species to be called "invasive," it must ________.
I. be introduced to a new area
II. spread rapidly in this new area
III. compete with native species successfully
Free
(Multiple Choice)
4.8/5 (31)
Correct Answer:Verified
E
In temperate lakes, the surface water is replenished with nutrients during turnovers that occur in the ________.
Free
(Multiple Choice)
4.8/5 (36)
Correct Answer:Verified
A
Turnover of water in temperate lakes during the spring and fall is made possible by which of the following?
(Multiple Choice)
4.9/5 (36)
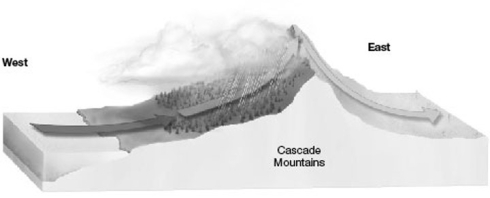 -In the figure above, which direction will have a desert biome?
(Multiple Choice)
4.9/5 (31)
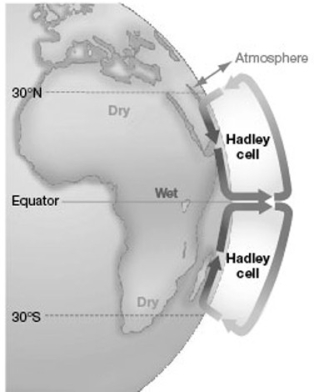 -In the map above, where will the weather be wetter?
I. near 30° N
II. near 30° S
III. near the Equator
-In the map above, where will the weather be wetter?
I. near 30° N
II. near 30° S
III. near the Equator
(Multiple Choice)
4.7/5 (28)
How does solar radiation (per unit area) vary with latitude?
(Multiple Choice)
4.7/5 (39)
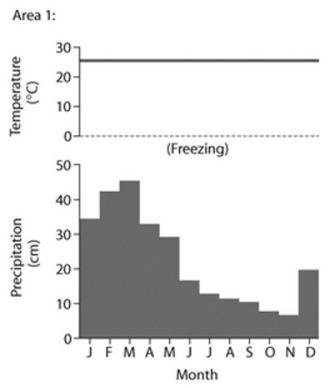
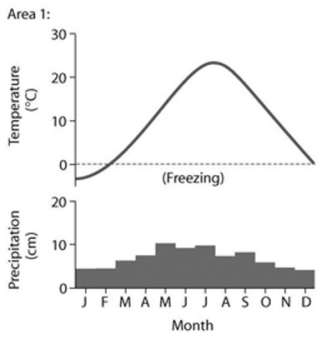
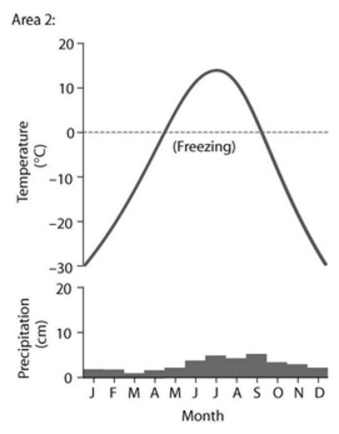
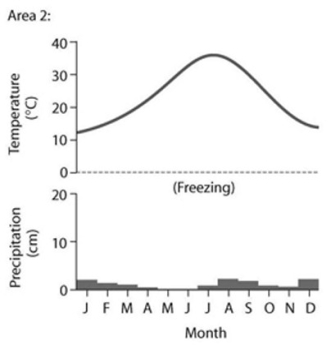 -Based on the data in the accompanying figure, which of the following statements are correct?
I. Area 1 would be considered a desert because of its high average temperature.
II. Area 1 has more average precipitation than Area 2.
III. Area 2 would be considered a desert because of its low average precipitation.
IV. Area 2 has a larger annual temperature variation.
-Based on the data in the accompanying figure, which of the following statements are correct?
I. Area 1 would be considered a desert because of its high average temperature.
II. Area 1 has more average precipitation than Area 2.
III. Area 2 would be considered a desert because of its low average precipitation.
IV. Area 2 has a larger annual temperature variation.
(Multiple Choice)
4.8/5 (35)
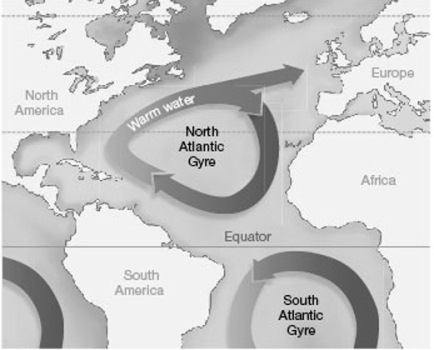 In the map above, which region would have milder weather than expected without the ocean currents?
(Multiple Choice)
4.8/5 (32)
Which of the following levels of ecological organization is arranged in the correct sequence from most to least inclusive?
(Multiple Choice)
4.7/5 (34)
-Based on the data in the accompanying figure, which of the following statements are correct?
I. Area 1 has more average precipitation than Area 2.
II. Area 1 has a higher average temperature than Area 2.
III. Both areas have low variation in monthly precipitation.
IV. Area 2 has a lower annual temperature variation compared to Area 1.
(Multiple Choice)
4.8/5 (32)
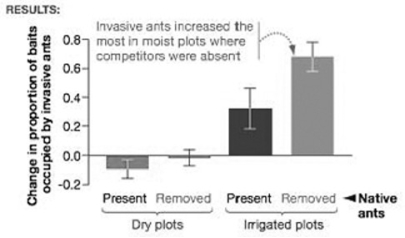 The accompanying graph shows data from a research study designed to test the hypothesis that both abiotic and biotic factors can affect the distribution of invasive Argentine ants. Using the graph, identify the statement that is best supported by the data.
(Multiple Choice)
4.8/5 (35)
Which of the following is responsible for the differences in summer and winter temperature stratification of deep temperate-zone lakes?
(Multiple Choice)
4.7/5 (28)
The diagram shows a generalized cross section of the marine environment with various zones labeled with letters. 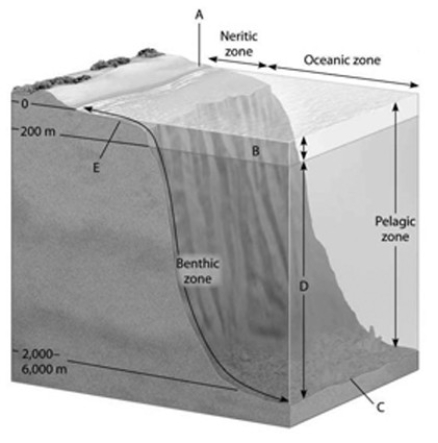 -Which zone experiences the most abiotic change over a 24-hour period?
(Multiple Choice)
4.7/5 (40)
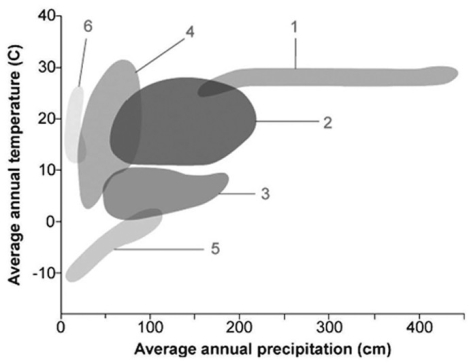 -Which of the following biomes has the highest variation in annual temperature?
(Multiple Choice)
4.9/5 (31)
The diagram shows a generalized cross section of the marine environment with various zones labeled with letters.
-Which zone has a condition of constant temperature?
(Multiple Choice)
4.8/5 (31)
Which of the following can be said about light in aquatic environments?
(Multiple Choice)
4.7/5 (35)
-In the figure, which number would designate the biome with the highest variation in annual precipitation?
(Multiple Choice)
5.0/5 (34)
Theoretically, which would be the most effective way to disrupt a Hadley cell?
(Multiple Choice)
4.9/5 (36)
Which of the following statements regarding altitude and climate are TRUE?
I. Species composition on different sides of a mountain range are often different from each other.
II. Rain shadows may appear on one side of a mountain range.
III. The higher the altitude, the warmer the climate.
IV. Both sides of a mountain range generally receive equal amounts of precipitation.
(Multiple Choice)
4.8/5 (36)
Filters
- Essay(0)
- Multiple Choice(0)
- Short Answer(0)
- True False(0)
- Matching(0)