Exam 48: Oxygen and Carbon Dioxide Transport
Exam 1: Physical Foundations Ii: Electrical Force Potential Capacitance and Current9 Questions
Exam 2: Chemical Foundations I: Chemical Energy and Intermolecular Forces16 Questions
Exam 3: Chemical Foundations Ii: Concentration and Kinetics12 Questions
Exam 4: Diffusion12 Questions
Exam 5: Electrochemical Potential and Free Energy12 Questions
Exam 6: Cell Structure18 Questions
Exam 7: Dna and Protein Synthesis25 Questions
Exam 8: Protein Structure17 Questions
Exam 9: Biological Membranes20 Questions
Exam 10: Passive Transport and Facilitated Diffusion16 Questions
Exam 11: Active Transport: Pumps and Exchangers16 Questions
Exam 12: Osmosis and Osmotic Pressure11 Questions
Exam 13: Cell Signaling22 Questions
Exam 14: ATP Production I: Glycolysis15 Questions
Exam 15: Atp Production Ii: Tca Cycle and Oxidative Phosphorylation17 Questions
Exam 16: Atp Production Iii: Fatty Acid Oxidation and Amino Acid Oxidation15 Questions
Exam 17: Origin of the Membrane Potential17 Questions
Exam 18: The Action Potential18 Questions
Exam 19: Propagation of the Action Potential19 Questions
Exam 20: Skeletal Muscle Mechanics18 Questions
Exam 21: Contractile Mechanisms in Skeletal Muscle21 Questions
Exam 22: Neuromuscular Junction and Ec Coupling25 Questions
Exam 23: Muscle Energetics Fatigue and Training21 Questions
Exam 24: Smooth Muscle16 Questions
Exam 25: Organization of the Nervous System14 Questions
Exam 26: Cells Synapses and Neurotransmitters15 Questions
Exam 27: Cutaneous Sensory Systems20 Questions
Exam 28: Spinal Reflexes14 Questions
Exam 29: Balance and Control of Movement17 Questions
Exam 30: the Chemical Senses18 Questions
Exam 31: Hearing20 Questions
Exam 32: Vision19 Questions
Exam 33: Autonomic Nervous System18 Questions
Exam 34: Overview of the Cv System and Blood16 Questions
Exam 35: Plasma and Red Blood Cells14 Questions
Exam 36: White Blood Cells and Inflammation17 Questions
Exam 37: The Heart As a Pump22 Questions
Exam 38: Cellular Basis of Cardiac Contractility17 Questions
Exam 39: the Cardiac Function Curve16 Questions
Exam 40: Vascular Function: Hemodynamics16 Questions
Exam 41: Microcirculation and Solute Exchange18 Questions
Exam 42: Regulation of Perfusion14 Questions
Exam 43: Integration of Cardiac Output and Venous Return14 Questions
Exam 44: Regulation of Arterial Pressure22 Questions
Exam 45: Mechanics of Breathing18 Questions
Exam 46: Lung Volumes and Airway Resistance19 Questions
Exam 47: Gas Exchange in the Lung20 Questions
Exam 48: Oxygen and Carbon Dioxide Transport14 Questions
Exam 49: Acid Base Physiology I Bicarbonate Buffers and Respiratory Compensation12 Questions
Exam 50: Control of Ventilation15 Questions
Exam 51: Anatomy and Renal Overview18 Questions
Exam 52: Glomerular Filtration16 Questions
Exam 53: Tubular Reabsorption and Secretion23 Questions
Exam 54: Concentration and Dilution of Urine22 Questions
Exam 55: Mouth and Esophagus17 Questions
Exam 56: The Stomach28 Questions
Exam 57: Intestinal and Colonic Motility29 Questions
Exam 58: Pancreatic and Biliary Secretion23 Questions
Exam 59: Digestion and Absorption of the Macronutrients30 Questions
Exam 60: Energy Balance and Regulation of Food Intake21 Questions
Exam 61: General Principles of Endocrinology18 Questions
Exam 62: Hypothalamus and Pituitary Gland16 Questions
Exam 63: The Thyroid Gland22 Questions
Exam 64: The Endocrine Pancreas14 Questions
Exam 65: The Adrenal Cortex25 Questions
Exam 66: The Adrenal Medulla11 Questions
Exam 67: The Calcitropic Hormones26 Questions
Exam 68: Calcium and Phosphorus Homeostasis Ii19 Questions
Exam 69: Female Reproductive Physiology19 Questions
Select questions type
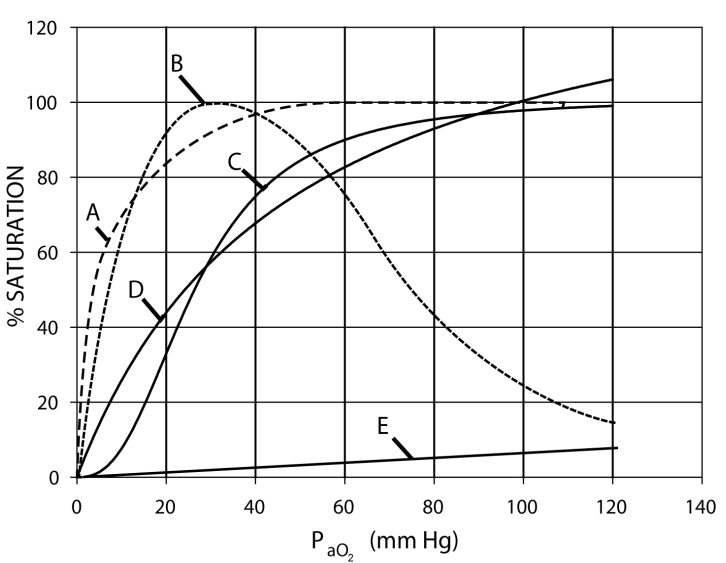
In the figure, which curve represents the normal hemoglobin oxygen dissociation curve?
Free
(Multiple Choice)
4.9/5  (36)
(36)
Correct Answer: Verified
C
Which of the following DOES NOT shift the hem oglo bin oxygen dissociation curve to the right?
Free
(Multiple Choice)
4.8/5 (35)
Correct Answer:Verified
B
Positive cooperativity mak es the oxygen disso ciation curve
(Multiple Choice)
4.9/5 (43)
The per cent of the net delivery of CO2 from tissue to lungs that is carried by HCO3- is about
(Multiple Choice)
4.8/5 (33)
Shifting the hemoglobin oxygen dissociation curve to the right
(Multiple Choice)
4.9/5 (49)
Filters
- Essay(0)
- Multiple Choice(0)
- Short Answer(0)
- True False(0)
- Matching(0)