Exam 39: Working With Tables and Charts
Exam 1: Microsoft Access Basics46 Questions
Exam 2: Creating a Database46 Questions
Exam 3: Creating Queries46 Questions
Exam 4: Creating and Modifying Forms46 Questions
Exam 5: Creating and Modifying Reports46 Questions
Exam 6: Integrating Access46 Questions
Exam 7: Enhancing Table Design46 Questions
Exam 8: Using Advanced Queries46 Questions
Exam 9: Using Advanced Form Features46 Questions
Exam 10: Adding Advanced Features to Reports46 Questions
Exam 11: Creating and Running Macros46 Questions
Exam 12: Automating Database Processes46 Questions
Exam 13: Programming in Access46 Questions
Exam 14: Creating Database Security and Documentation46 Questions
Exam 15: Microsoft Excel Basics46 Questions
Exam 16: Using Advanced Chart Features46 Questions
Exam 17: Improving Data Accuracy46 Questions
Exam 18: Creating Pivottables and Pivotcharts46 Questions
Exam 19: Using Powerful Excel Functions46 Questions
Exam 20: Creating and Using Macros46 Questions
Exam 21: Working With Auditing and Analysis Tools46 Questions
Exam 22: Protecting, Tracking, and Sharing Workbooks46 Questions
Exam 23: Importing and Exporting Data46 Questions
Exam 24: Changing the Appearance of a Worksheet46 Questions
Exam 25: Organizing the Worksheet46 Questions
Exam 26: Entering Worksheet Formulas46 Questions
Exam 27: Using Functions46 Questions
Exam 28: Enhancing a Worksheet46 Questions
Exam 29: Working With Multiple Worksheets and Workbooks46 Questions
Exam 30: Working With Charts46 Questions
Exam 31: Applying Advanced Formats to Worksheets46 Questions
Exam 32: Microsoft Office 2010 and the Internet46 Questions
Exam 33: Microsoft Powerpoint Basics46 Questions
Exam 34: Sharing and Delivering Presentations46 Questions
Exam 35: Creating Enhancing Powerpoint Presentations46 Questions
Exam 36: Working With Visual Elements46 Questions
Exam 37: Expanding on Powerpoint Basics46 Questions
Exam 38: Editing and Formatting Slide Content46 Questions
Exam 39: Working With Tables and Charts46 Questions
Exam 40: Working With Visual and Sound Objects46 Questions
Exam 41: Customizing Slides46 Questions
Exam 42: Importing and Exporting Information46 Questions
Exam 43: Microsoft Word Basics46 Questions
Exam 44: Working With Templates and Styles46 Questions
Exam 45: Customizing Tables and Creating Charts46 Questions
Exam 46: Creating Mail Merge Documents46 Questions
Exam 47: Sharing Documents46 Questions
Exam 48: Working With Long Documents46 Questions
Exam 49: Creating Indexes and Tables of Contents, Figures, and Authorities46 Questions
Exam 50: Working With Long Documents46 Questions
Exam 51: Creating Indexes and Tables of Contents, Figures, and Authorities46 Questions
Exam 52: Basic Editing46 Questions
Exam 53: Helpful Word Features46 Questions
Exam 54: Formatting Text46 Questions
Exam 55: Formatting Paragraphs and Documents46 Questions
Exam 56: Working With Graphics46 Questions
Exam 57: Working With Documents46 Questions
Exam 58: Increasing Efficiency Using Word46 Questions
Exam 59: Enhancing Documents46 Questions
Select questions type
The ____ command enables you to quickly copy and paste one or more selected slides.
Free
(Multiple Choice)
4.8/5  (38)
(38)
Correct Answer: Verified
D
Text and numbers you enter in a table should appear in a small font size.
Free
(True/False)
4.9/5 (40)
Correct Answer:Verified
False
A ____ chart type is effective in finding combinations between two sets of data.
Free
(Multiple Choice)
4.9/5 (29)
Correct Answer:Verified
D
The ____________________ chart element represents a line bordering the chart plot area used as a frame of reference for measurement.
(Short Answer)
4.8/5 (38)
To promote and demote objects in the organization chart hierarchy, you can use the Promote and Demote buttons on the ____ tab.
(Multiple Choice)
4.8/5 (30)
Case PPT 6-1 Jennifer is a satellite engineer working on a PowerPoint presentation to inform research colleagues of satellite scatter potential over the next three years. Some presentation data resides in a large table and Jennifer is having trouble getting it to fit on one slide. The table has five columns and 22 rows. All data cells are formatted in scientific notation. Since you are the Senior Information Technology analyst, Jennifer asks you for assistance. Upon reviewing the table data structure, you help Jennifer ____.
(Multiple Choice)
4.8/5 (37)
Choosing the line styles and weights before drawing a table can save formatting time later.
(True/False)
4.8/5 (32)
A ____ chart type is useful when you want to make comparisons among individual items.
(Multiple Choice)
4.8/5 (35)
Describe a pie chart and a doughnut chart and explain the difference between the two chart types.
(Essay)
4.7/5 (44)
FIGURE PPT 6-7 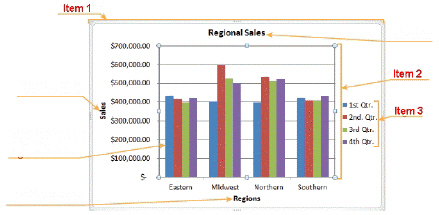 In the accompanying figure, item 2 points to the ____.
(Multiple Choice)
4.9/5 (35)
Case PPT 6-1 Jennifer is a satellite engineer working on a PowerPoint presentation to inform research colleagues of satellite scatter potential over the next three years. Some presentation data resides in a large table and Jennifer is having trouble getting it to fit on one slide. The table has five columns and 22 rows. All data cells are formatted in scientific notation. Since you are the Senior Information Technology analyst, Jennifer asks you for assistance. As you review the issue, you first suggest that Jennifer ____.
(Multiple Choice)
4.8/5 (36)
To combine the content of two or more cells into a single cell, you can merge the cells by using the Table Merge tool.
(True/False)
4.9/5 (33)
When you create a new table in PowerPoint, a ____ is applied to the table.
(Multiple Choice)
4.8/5 (35)
FIGURE PPT 6-7  In the accompanying figure, item 3 points to the ____.
(Multiple Choice)
4.8/5 (25)
A ____ chart type is effective in making comparisons among individual items or showing changes over a period of time.
(Multiple Choice)
4.8/5 (35)
Organization charts are most commonly used to show the structure of ____ in a company.
(Multiple Choice)
4.8/5 (35)
To use pie charts to compare data, you can insert more than one pie chart on a slide.
(True/False)
4.7/5 (23)
Filters
- Essay(0)
- Multiple Choice(0)
- Short Answer(0)
- True False(0)
- Matching(0)