Exam 53: Population Ecology
Exam 1: Introduction: Themes in the Study of Life64 Questions
Exam 2: The Chemical Context of Life83 Questions
Exam 3: Water and Life70 Questions
Exam 4: Carbon and the Molecular Diversity of Life71 Questions
Exam 5: The Structure and Function of Large Biological Molecules109 Questions
Exam 6: A Tour of the Cell80 Questions
Exam 7: Membrane Structure and Function80 Questions
Exam 8: An Introduction to Metabolism80 Questions
Exam 9: Cellular Respiration and Fermentation107 Questions
Exam 10: Photosynthesis81 Questions
Exam 11: Cell Communication69 Questions
Exam 12: The Cell Cycle79 Questions
Exam 13: Meiosis and Sexual Life Cycles70 Questions
Exam 14: Mendel and the Gene Idea73 Questions
Exam 15: The Chromosomal Basis of Inheritance61 Questions
Exam 16: The Molecular Basis of Inheritance57 Questions
Exam 17: From Gene to Protein83 Questions
Exam 18: Regulation of Gene Expression99 Questions
Exam 19: Viruses47 Questions
Exam 20: Biotechnology72 Questions
Exam 21: Genomes and Their Evolution42 Questions
Exam 22: Descent with Modification: A Darwinian View of Life55 Questions
Exam 23: The Evolution of Populations78 Questions
Exam 24: The Origin of Species63 Questions
Exam 25: The History of Life on Earth75 Questions
Exam 26: Phylogeny and the Tree of Life73 Questions
Exam 27: Bacteria and Archaea78 Questions
Exam 28: Protists76 Questions
Exam 29: Plant Diversity I: How Plants Colonized Land74 Questions
Exam 30: Plant Diversity II: The Evolution of Seed Plants102 Questions
Exam 31: Fungi89 Questions
Exam 32: An Overview of Animal Diversity74 Questions
Exam 33: An Introduction to Invertebrates93 Questions
Exam 34: The Origin and Evolution of Vertebrates109 Questions
Exam 35: Plant Structure, Growth, and Development67 Questions
Exam 36: Resource Acquisition and Transport in Vascular Plants82 Questions
Exam 37: Soil and Plant Nutrition83 Questions
Exam 38: Angiosperm Reproduction and Biotechnology86 Questions
Exam 39: Plant Responses to Internal and External Signals108 Questions
Exam 40: Basic Principles of Animal Form and Function77 Questions
Exam 41: Animal Nutrition64 Questions
Exam 42: Circulation and Gas Exchange90 Questions
Exam 43: The Immune System100 Questions
Exam 44: Osmoregulation and Excretion69 Questions
Exam 45: Hormones and the Endocrine System72 Questions
Exam 46: Animal Reproduction94 Questions
Exam 47: Animal Development92 Questions
Exam 48: Neurons, Synapses, and Signaling73 Questions
Exam 49: Nervous Systems65 Questions
Exam 50: Sensory and Motor Mechanisms82 Questions
Exam 51: Animal Behavior69 Questions
Exam 52: An Introduction to Ecology and the Biosphere73 Questions
Exam 53: Population Ecology79 Questions
Exam 54: Community Ecology77 Questions
Exam 55: Ecosystems and Restoration Ecology81 Questions
Exam 56: Conservation Biology and Global Change67 Questions
Select questions type
Which of the following could be a density-independent factor limiting human population growth?
Free
(Multiple Choice)
4.9/5  (33)
(33)
Correct Answer: Verified
B
Consider two forests: one is an undisturbed old-growth forest, while the other has recently been logged. In which forest are species likely to experience exponential growth, and why?
Free
(Multiple Choice)
4.9/5 (34)
Correct Answer:Verified
C
Which of the following is the equation for zero population growth (ZPG)?
Free
(Multiple Choice)
4.7/5 (31)
Correct Answer:Verified
A
Uniform spacing patterns in plants such as the creosote bush are most often associated with
(Multiple Choice)
4.9/5 (28)
In 2008, the population of New Zealand was approximately 4,275,000 people. If the birth rate was 14 births for every 1,000 people, approximately how many births occurred in New Zealand in 2008?
(Multiple Choice)
4.7/5 (42)
Use the survivorship curves in Figure 53.1 to answer the following questions.
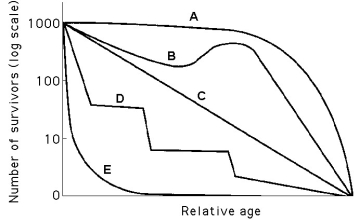 Figure 53.1
-Which curve best describes survivorship in humans who live in undeveloped nations?
Figure 53.1
-Which curve best describes survivorship in humans who live in undeveloped nations?
(Multiple Choice)
4.8/5 (39)
A population of white-footed mice becomes severely overpopulated in a habitat that has been disturbed by human activity. Sometimes intrinsic factors cause the population to increase in mortality and lower reproduction rates to occur in reaction to the stress of overpopulation. Which of the following is an example of intrinsic population control?
(Multiple Choice)
4.8/5 (34)
Which of the following sets of measurements is the most useful when studying populations?
(Multiple Choice)
4.8/5 (27)
Which pair of terms most accurately describes life history traits for a stable population of wolves?
(Multiple Choice)
4.9/5 (39)
Which of the following graphs illustrates the growth curve of a small population of rodents that has grown to reach a static carrying capacity?
(Multiple Choice)
4.9/5 (36)
Please read the paragraph below and review Figure 53.2 to answer the following question.
Researchers in the Netherlands studied the effects of parental care given in European kestrels over five years. The researchers transferred chicks among nests to produce reduced broods (three or four chicks), normal broods (five or six chicks), and enlarged broods (seven or eight chicks). They then measured the percentage of male and female parent birds that survived the following winter. (Both males and females provide care for chicks.)
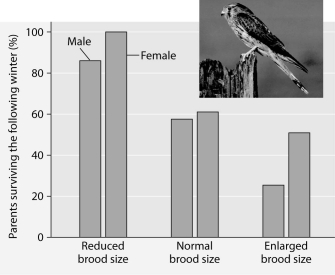 Figure 53.2: Brood size manipulations in the kestrel: Effects on offspring and parent survival.
-Which of the following is a likely graphic outcome of a population of deer introduced to an island with an adequate herbivory and without natural predators, parasites, or disease?
Figure 53.2: Brood size manipulations in the kestrel: Effects on offspring and parent survival.
-Which of the following is a likely graphic outcome of a population of deer introduced to an island with an adequate herbivory and without natural predators, parasites, or disease?
(Multiple Choice)
4.9/5 (42)
Which of the following is the best example of uniform distribution?
(Multiple Choice)
4.9/5 (42)
Use the survivorship curves in Figure 53.1 to answer the following questions.
Figure 53.1
-Which curve best describes survivorship in marine molluscs?
(Multiple Choice)
4.7/5 (31)
Which pattern of reproduction is correctly paired with a species?
(Multiple Choice)
4.9/5 (30)
Why do some invertebrates, such as lobsters, show a "stair-step" survivorship curve?
(Multiple Choice)
4.8/5 (37)
Which of the following pairs of reproductive strategies is consistent with energetic trade-off and reproductive success?
(Multiple Choice)
4.8/5 (23)
Refer to Figure 53.4 and then answer the following questions.
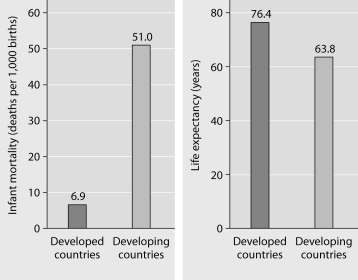 Figure 53.4: Infant mortality and life expectancy at birth in developed and developing countries (data as of 2005).
-In terms of demographics, which country is likely to experience the greatest population growth problem over the next ten years?
Figure 53.4: Infant mortality and life expectancy at birth in developed and developing countries (data as of 2005).
-In terms of demographics, which country is likely to experience the greatest population growth problem over the next ten years?
(Multiple Choice)
4.9/5 (34)
Filters
- Essay(0)
- Multiple Choice(0)
- Short Answer(0)
- True False(0)
- Matching(0)