Exam 31: Fungi
Exam 1: Biology and the Tree of Life35 Questions
Exam 2: Water and Carbon: the Chemical Basis of Life51 Questions
Exam 3: Protein Structure and Function54 Questions
Exam 4: Nucleic Acids and the Rna World40 Questions
Exam 5: An Introduction to Carbohydrates40 Questions
Exam 6: Lipids, membranes, and the First Cells54 Questions
Exam 7: Inside the Cell38 Questions
Exam 8: Cell-Cell Interactions38 Questions
Exam 9: Cellular Respiration and Fermentation38 Questions
Exam 10: Photosynthesis39 Questions
Exam 11: The Cell Cycle39 Questions
Exam 12: Meiosis39 Questions
Exam 13: Mendel and the Gene42 Questions
Exam 14: Dna and the Gene: Synthesis and Repair39 Questions
Exam 15: How Genes Work39 Questions
Exam 16: Transcription, RNA Processing, and Translation39 Questions
Exam 17: Control of Gene Expression in Bacteria38 Questions
Exam 18: Control of Gene Expression in Eukaryotes39 Questions
Exam 19: Analyzing and Engineering Genes41 Questions
Exam 20: Genomics41 Questions
Exam 21: Principles of Development39 Questions
Exam 22: An Introduction to Animal Development40 Questions
Exam 23: An Introduction to Plant Development37 Questions
Exam 24: Evolution by Natural Selection42 Questions
Exam 25: Evolutionary Processes50 Questions
Exam 26: Speciation41 Questions
Exam 27: Phylogenies and the History of Life43 Questions
Exam 28: Bacteria and Archaea38 Questions
Exam 29: Protists36 Questions
Exam 30: Green Algae and Land Plants54 Questions
Exam 31: Fungi40 Questions
Exam 32: An Introduction to Animals42 Questions
Exam 33: Protostome Animals38 Questions
Exam 34: Deuterostome Animals43 Questions
Exam 35: Viruses35 Questions
Exam 36: Plant Form and Function36 Questions
Exam 37: Water and Sugar Transport in Plants42 Questions
Exam 38: Plant Nutrition37 Questions
Exam 39: Plant Sensory Systems, signals, and Responses65 Questions
Exam 40: Plant Reproduction41 Questions
Exam 41: Animal Form and Function38 Questions
Exam 42: Water and Electrolyte Balance in Animals41 Questions
Exam 43: Animal Nutrition43 Questions
Exam 44: Gas Exchange and Circulation46 Questions
Exam 45: Electrical Signals in Animals40 Questions
Exam 46: Animal Sensory Systems and Movement43 Questions
Exam 47: Chemical Signals in Animals38 Questions
Exam 48: Animal Reproduction39 Questions
Exam 49: The Immune System in Animals38 Questions
Exam 50: An Introduction to Ecology41 Questions
Exam 51: Behavioural Ecology39 Questions
Exam 52: Population Ecology49 Questions
Exam 53: Community Ecology39 Questions
Exam 54: Ecosystems41 Questions
Exam 55: Biodiversity and Conservation Biology38 Questions
Select questions type
Canadian and Swiss researchers (van der Heijden et al., 1998)interested in factors affecting biodiversity, grew a variety of grassland plants in combination with one of four arbuscular mycorrhizal (AMF)species, no AMF, or all four AMF species together; and they measured plant growth under each set of conditions. All plant species were grown in each plot, so they always competed with each other with the only difference being which AMF were present. Use the graphs in Figure 31.5 to answer the questions that follow. Note that the x-axis labels indicate the number and identity of AMF species (bar 0 = no fungi; bars A-D = individual AMF species; bar A+B+C+D = all AMF species together). The y-axis indicates the amount (grams)of plant biomass for the species shown in italics above each graph. Graph (e)is the total biomass (grams)of all 11 plant species combined; graph (f)is the biomass of Bromus erectus plants only, separated from the total.
 Figure 31.4
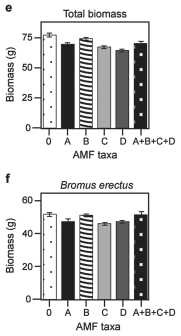 Figure 31.5
-Why does total biomass (graph e,Figure 31.5)not vary with AMF diversity?
Figure 31.5
-Why does total biomass (graph e,Figure 31.5)not vary with AMF diversity?
Free
(Multiple Choice)
4.7/5  (42)
(42)
Correct Answer: Verified
C
Microsporidians are considered parasitic because of the ability to penetrate their host cells using this structure.
Free
(Multiple Choice)
4.9/5 (42)
Correct Answer:Verified
B
There is much discussion in the media about protecting biodiversity, but does it really matter? Canadian and Swiss researchers wanted to know if the diversity of arbuscular mycorrhizal fungi (AMF)was important to the productivity of grasslands (M.G.A. van der Heijden, J. N. Klironomos, M. Ursic, P. Moutoglis, R. Streitwolf-Engel, T. Boler, A. Wiemken, and I. R. Sanders. 1998. Mycorrhizal fungal diversity determines plant biodiversity, ecosystem variability and productivity. Nature 396:69-72). Specifically, they wanted to know if it mattered which specific AMF species were present, or just that some type of AMF was present. They grew various plants in combination with one of four AMF species, no AMF, or all four AMF species together; and they measured plant growth under each set of conditions. All plant species were grown in each plot, so they always competed with each other with the only difference being which AMF species were present. Use the graphs in Figure 31.4 to answer the questions that follow. Note that the x-axis labels indicate the number and identity of AMF species (bar 0 = no fungi; bars A-D = individual AMF species; bar A+B+C+D = all AMF species together). The y-axis indicates the amount (grams)of plant biomass for the species shown in italics above each graph.
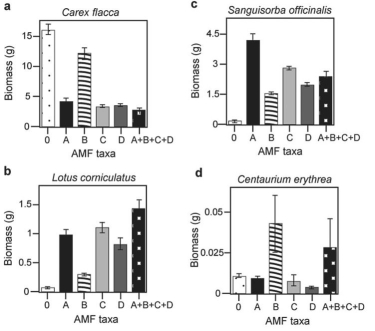 Figure 31.4
-Based on the graphs shown above,which of the following plant species is most likely not to form mycorrhizal associations?
Figure 31.4
-Based on the graphs shown above,which of the following plant species is most likely not to form mycorrhizal associations?
Free
(Multiple Choice)
4.8/5 (28)
Correct Answer:Verified
A
Figure 31.3 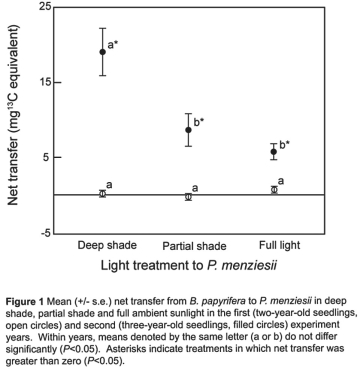 -Referring to Figure 31.3 (Simard et al.,1997-third-year seedlings only),shown above,was there a net transfer of carbon from plants in sunlight to plants in shade?
(Multiple Choice)
4.8/5 (32)
Canadian and Swiss researchers (van der Heijden et al., 1998)interested in factors affecting biodiversity, grew a variety of grassland plants in combination with one of four arbuscular mycorrhizal (AMF)species, no AMF, or all four AMF species together; and they measured plant growth under each set of conditions. All plant species were grown in each plot, so they always competed with each other with the only difference being which AMF were present. Use the graphs in Figure 31.5 to answer the questions that follow. Note that the x-axis labels indicate the number and identity of AMF species (bar 0 = no fungi; bars A-D = individual AMF species; bar A+B+C+D = all AMF species together). The y-axis indicates the amount (grams)of plant biomass for the species shown in italics above each graph. Graph (e)is the total biomass (grams)of all 11 plant species combined; graph (f)is the biomass of Bromus erectus plants only, separated from the total.
Figure 31.4
Figure 31.5
-Using grams of biomass as an indicator of abundance,which species is most likely the dominant species in this ecosystem (see Figure 31.5)?
(Multiple Choice)
4.9/5 (32)
Which fungal class is not matched with its most common habitat?
(Multiple Choice)
4.8/5 (44)
Based on the idea that fungi have pores between their cell walls,allowing cytoplasm to move from one end of the mycelium to the other,which of the following hypotheses is the most plausible?
(Multiple Choice)
4.8/5 (33)
The researchers then wanted to know if plant biodiversity and productivity would increase in a natural system as a result of increasing AMF diversity beyond just four species. Consider Figure 31.6 below (Figure 2 from van der Heijden et al. 1998):
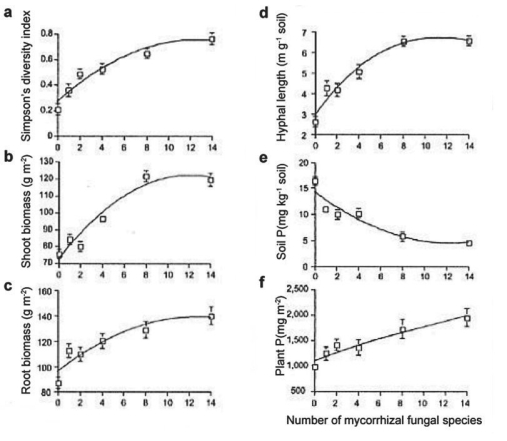 Figure 31.6
-If the number of mycorrhizal fungal species increases to 20,the amount of P in the soil will likely decline to zero (Figure 31.6).True or false?
Figure 31.6
-If the number of mycorrhizal fungal species increases to 20,the amount of P in the soil will likely decline to zero (Figure 31.6).True or false?
(True/False)
4.9/5 (38)
It has been hypothesized that fungi and plants have a mutualistic relationship because plants make sugars available for the fungi's use.What is the best evidence in support of this hypothesis?
(Multiple Choice)
4.8/5 (40)
You are a forester charged with increasing productivity in a South American forest newly planted with pines from Oregon.You believe that the southern forest lacks the fungal diversity needed by the North American pines,and that this lack of fungi is affecting the pines' productivity,but you have no evidence to support your ideas.
Describe what you believe would be the best method of providing the appropriate fungi to the newly transplanted pines described in the previous question.Be sure to identify the source of the fungi and the stage of the life cycle during which you would transport them.Also explain how you would introduce the fungi to their new home.Explain why you believe your method would work,including relevant elements of fungal biology.
(Essay)
4.8/5 (38)
Canadian and Swiss researchers (van der Heijden et al., 1998)interested in factors affecting biodiversity, grew a variety of grassland plants in combination with one of four arbuscular mycorrhizal (AMF)species, no AMF, or all four AMF species together; and they measured plant growth under each set of conditions. All plant species were grown in each plot, so they always competed with each other with the only difference being which AMF were present. Use the graphs in Figure 31.5 to answer the questions that follow. Note that the x-axis labels indicate the number and identity of AMF species (bar 0 = no fungi; bars A-D = individual AMF species; bar A+B+C+D = all AMF species together). The y-axis indicates the amount (grams)of plant biomass for the species shown in italics above each graph. Graph (e)is the total biomass (grams)of all 11 plant species combined; graph (f)is the biomass of Bromus erectus plants only, separated from the total.
Figure 31.4
Figure 31.5
-What is the major difference between Bromus erectus (graph f)and the other plant species (graphs a-d)included in the study?
(Multiple Choice)
4.8/5 (28)
It has been hypothesized that fungi and plants have a mutualistic relationship because fungi provide critical nitrogen for the plants' use.How do we know this happens?
(Multiple Choice)
4.7/5 (30)
Why is it reasonable to hypothesize that lichens might predict air quality?
(Multiple Choice)
4.9/5 (37)
Which of these fungal features supports the phylogenetic conclusion that fungi are more closely related to animals than plants?
(Multiple Choice)
4.9/5 (41)
Why are mycorrhizal fungi superior to plants at acquiring mineral nutrition from the soil?
(Multiple Choice)
4.8/5 (25)
Basidiomycetes are the only fungal group capable of synthesizing lignin peroxidase.What advantage does this group of fungi have over other fungi because of this capability?
(Multiple Choice)
4.8/5 (33)
Suzanne Simard and colleagues knew that the same mycorrhizal fungal species could colonize multiple types of trees. They wondered if the same fungal individual would colonize different trees, forming an underground network that potentially could transport carbon and nutrients from one tree to another (S. Simard et al. 1997. Net transfer of carbon between mycorrhizal tree species in the field. Nature 388:579-82). Figure 31.2 illustrates the team's experimental setup. Pots containing seedlings of three different tree species were set up and grown under natural conditions for three years; two of the three species formed ectomycorrhizae (Douglas fir, birch)and the other (cedar)formed arbuscular mycorrhizae. For the experiment, the researchers placed airtight bags over the Douglas fir and birch seedlings; into each bag, they injected either carbon dioxide made from carbon-13 or carbon-14 (¹³CO₂ and ¹⁴CO₂, isotopes of carbon). As the seedlings photosynthesized, the radioactive carbon dioxide was converted into radioactively labeled sugars that could be tracked and measured by the researchers.
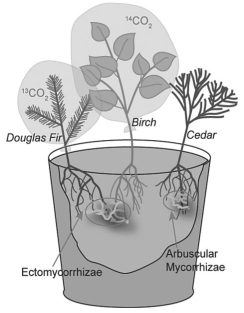 Figure 31.2
-Referring to Simard et al.(1997),which design element is the control in this experiment and why?
Figure 31.2
-Referring to Simard et al.(1997),which design element is the control in this experiment and why?
(Multiple Choice)
4.9/5 (33)
Suzanne Simard and colleagues knew that the same mycorrhizal fungal species could colonize multiple types of trees. They wondered if the same fungal individual would colonize different trees, forming an underground network that potentially could transport carbon and nutrients from one tree to another (S. Simard et al. 1997. Net transfer of carbon between mycorrhizal tree species in the field. Nature 388:579-82). Figure 31.2 illustrates the team's experimental setup. Pots containing seedlings of three different tree species were set up and grown under natural conditions for three years; two of the three species formed ectomycorrhizae (Douglas fir, birch)and the other (cedar)formed arbuscular mycorrhizae. For the experiment, the researchers placed airtight bags over the Douglas fir and birch seedlings; into each bag, they injected either carbon dioxide made from carbon-13 or carbon-14 (¹³CO₂ and ¹⁴CO₂, isotopes of carbon). As the seedlings photosynthesized, the radioactive carbon dioxide was converted into radioactively labeled sugars that could be tracked and measured by the researchers.
Figure 31.2
-Referring to Simard et al.(1997),what is the result that would most strongly refute their hypothesis?
(Multiple Choice)
4.7/5 (40)
Canadian and Swiss researchers (van der Heijden et al., 1998)interested in factors affecting biodiversity, grew a variety of grassland plants in combination with one of four arbuscular mycorrhizal (AMF)species, no AMF, or all four AMF species together; and they measured plant growth under each set of conditions. All plant species were grown in each plot, so they always competed with each other with the only difference being which AMF were present. Use the graphs in Figure 31.5 to answer the questions that follow. Note that the x-axis labels indicate the number and identity of AMF species (bar 0 = no fungi; bars A-D = individual AMF species; bar A+B+C+D = all AMF species together). The y-axis indicates the amount (grams)of plant biomass for the species shown in italics above each graph. Graph (e)is the total biomass (grams)of all 11 plant species combined; graph (f)is the biomass of Bromus erectus plants only, separated from the total.
Figure 31.4
Figure 31.5
-Based on graphs (e)and (f)in Figure 31.5,which is the most well-supported prediction for the effect on total plant biomass if AMF diversity were increased to eight species?
(Multiple Choice)
4.7/5 (30)
Why is it important that ectomycorrhizal fungi (EMF)have peptidase enzymes?
(Multiple Choice)
4.8/5 (33)
Filters
- Essay(0)
- Multiple Choice(0)
- Short Answer(0)
- True False(0)
- Matching(0)