Exam 52: Population Ecology
Exam 1: Biology and the Tree of Life35 Questions
Exam 2: Water and Carbon: the Chemical Basis of Life51 Questions
Exam 3: Protein Structure and Function54 Questions
Exam 4: Nucleic Acids and the Rna World40 Questions
Exam 5: An Introduction to Carbohydrates40 Questions
Exam 6: Lipids, membranes, and the First Cells54 Questions
Exam 7: Inside the Cell38 Questions
Exam 8: Cell-Cell Interactions38 Questions
Exam 9: Cellular Respiration and Fermentation38 Questions
Exam 10: Photosynthesis39 Questions
Exam 11: The Cell Cycle39 Questions
Exam 12: Meiosis39 Questions
Exam 13: Mendel and the Gene42 Questions
Exam 14: Dna and the Gene: Synthesis and Repair39 Questions
Exam 15: How Genes Work39 Questions
Exam 16: Transcription, RNA Processing, and Translation39 Questions
Exam 17: Control of Gene Expression in Bacteria38 Questions
Exam 18: Control of Gene Expression in Eukaryotes39 Questions
Exam 19: Analyzing and Engineering Genes41 Questions
Exam 20: Genomics41 Questions
Exam 21: Principles of Development39 Questions
Exam 22: An Introduction to Animal Development40 Questions
Exam 23: An Introduction to Plant Development37 Questions
Exam 24: Evolution by Natural Selection42 Questions
Exam 25: Evolutionary Processes50 Questions
Exam 26: Speciation41 Questions
Exam 27: Phylogenies and the History of Life43 Questions
Exam 28: Bacteria and Archaea38 Questions
Exam 29: Protists36 Questions
Exam 30: Green Algae and Land Plants54 Questions
Exam 31: Fungi40 Questions
Exam 32: An Introduction to Animals42 Questions
Exam 33: Protostome Animals38 Questions
Exam 34: Deuterostome Animals43 Questions
Exam 35: Viruses35 Questions
Exam 36: Plant Form and Function36 Questions
Exam 37: Water and Sugar Transport in Plants42 Questions
Exam 38: Plant Nutrition37 Questions
Exam 39: Plant Sensory Systems, signals, and Responses65 Questions
Exam 40: Plant Reproduction41 Questions
Exam 41: Animal Form and Function38 Questions
Exam 42: Water and Electrolyte Balance in Animals41 Questions
Exam 43: Animal Nutrition43 Questions
Exam 44: Gas Exchange and Circulation46 Questions
Exam 45: Electrical Signals in Animals40 Questions
Exam 46: Animal Sensory Systems and Movement43 Questions
Exam 47: Chemical Signals in Animals38 Questions
Exam 48: Animal Reproduction39 Questions
Exam 49: The Immune System in Animals38 Questions
Exam 50: An Introduction to Ecology41 Questions
Exam 51: Behavioural Ecology39 Questions
Exam 52: Population Ecology49 Questions
Exam 53: Community Ecology39 Questions
Exam 54: Ecosystems41 Questions
Exam 55: Biodiversity and Conservation Biology38 Questions
Select questions type
The regular fluctuations in size of animal populations are termed
Free
(Multiple Choice)
4.7/5  (30)
(30)
Correct Answer: Verified
A
What can we NOT determine from examining age pyramids of human populations?
Free
(Multiple Choice)
4.9/5 (32)
Correct Answer:Verified
C
Assuming that these populations are density dependent,what is the likely outcome if the system depicted in the figure above were allowed to continue?
Free
(Multiple Choice)
4.8/5 (37)
Correct Answer:Verified
C
Figure 52.5 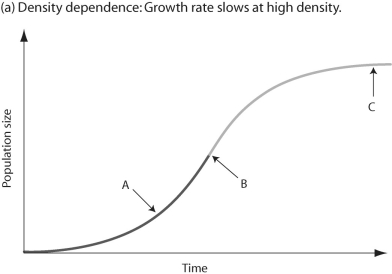 -In the figure above,which of the arrows represents the most rapid growth?
(Multiple Choice)
4.8/5 (36)
It is estimated that snow geese will be able to sustain an r of 0.088 indefinitely.If the flock currently contains 3000 individuals,how long will it take to double?
(Multiple Choice)
4.9/5 (37)
Figure 52.9 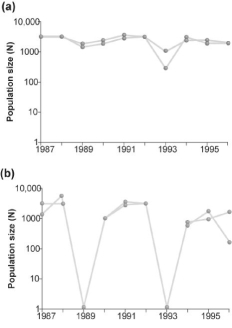 -Which of the two graphs in the figure above shows a population of organisms that has a strong population cycle?
(Multiple Choice)
4.8/5 (33)
It is estimated that a flock of wood buffalo crane should be able to sustain an r of 0.085 for the foreseeable future.If the flock currently contains 350 individuals,how long will it take for that population to double?
(Multiple Choice)
4.9/5 (28)
Figure 52.7 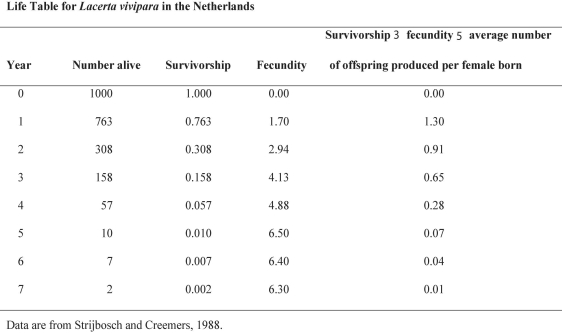 -Using information from the table above,calculate the net reproductive rate (R₀)for this population.
(Multiple Choice)
4.8/5 (42)
Based on the information in the abstract,which of the following statements is the most correct?
(Multiple Choice)
4.9/5 (32)
During the Lacerta vivipara lizard study,researchers monitored individuals on a daily basis to document the number of young produced by each female in the wild.What would be the best way to obtain the same type of data but not have to visit the site every day?
(Multiple Choice)
4.9/5 (34)
Which of these terms defines how the organism allocates resources to growth,reproduction,and activities or structures related to survival?
(Multiple Choice)
4.9/5 (29)
Figure 52.14 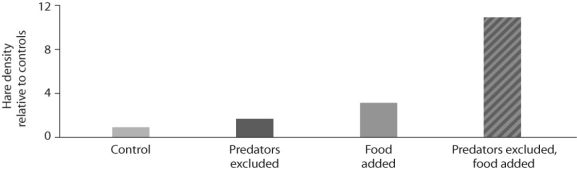 -Looking at the data in the figure above from the hare/lynx experiment,what conclusion can you draw?
(Multiple Choice)
4.8/5 (23)
Figure 52.7
-Using information from the table above,which year was the most successful for the population?
(Multiple Choice)
4.9/5 (39)
Figure 52.15 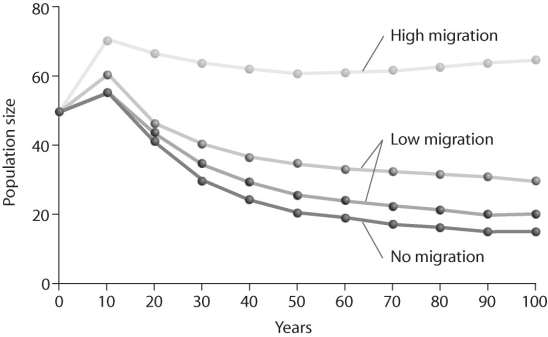 -Looking at the figure above,what is contributing significantly to stabilizing population size over time?
(Multiple Choice)
4.7/5 (35)
Figure 52.3 ![Figure 52.3 -Looking at figure above,the white rhinoceros [more than 1 000 kg (2 200 lb)] is likely to exhibit which of the following?](https://storage.examlex.com/TB3733/11ea46a8_f5b7_6b81_95d4_156e851979a3_TB3733_00.jpg) -Looking at figure above,the white rhinoceros [more than 1 000 kg (2 200 lb)] is likely to exhibit which of the following?
-Looking at figure above,the white rhinoceros [more than 1 000 kg (2 200 lb)] is likely to exhibit which of the following?
(Multiple Choice)
4.8/5 (33)
Figure 52.9
-Assuming graph (b)in Figure 52.8 is the result of some experimental treatment,what can be concluded?
(Multiple Choice)
4.9/5 (29)
Figure 52.2 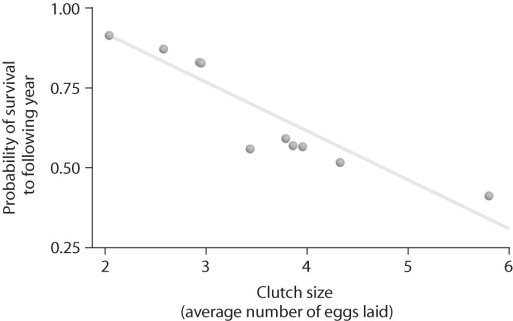 -Looking at the data in the figure above,what can be said about survival and clutch size?
(Multiple Choice)
4.8/5 (33)
A model that estimates the likelihood that a population will avoid extinction for a given period of time is called a(n)
(Multiple Choice)
4.7/5 (30)
Figure 52.4 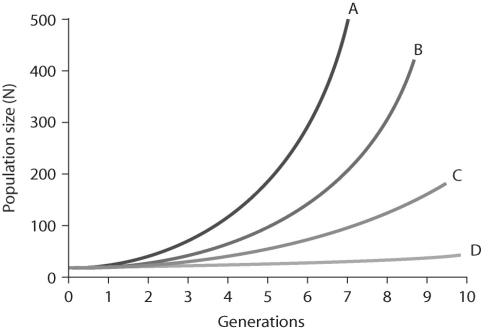 -In the figure above,which of the lines represents the highest per-capita rate increase (r)?
(Multiple Choice)
4.8/5 (31)
Filters
- Essay(0)
- Multiple Choice(0)
- Short Answer(0)
- True False(0)
- Matching(0)